20 Canadian Cities with the Highest Crime Rates in 2024

Share Post:

Canada maintains a reputation for being relatively safe, especially when compared to its southern neighbors.

However, no place is without its challenges. Crime is a reality here too, with certain areas experiencing higher risks due to a variety of factors including socioeconomic conditions, population density, and local law enforcement effectiveness.

In this analysis, we will identify the top 20 cities in Canada that are considered the most dangerous based on crime statistics and trends. The results may be unexpected for some, shedding light on the complexities of urban safety in Canada.

Top 20 Canadian Cities with High Crime Rates

20. Abbotsford, BC

Crime Rates in Abbotsford, BC Chart

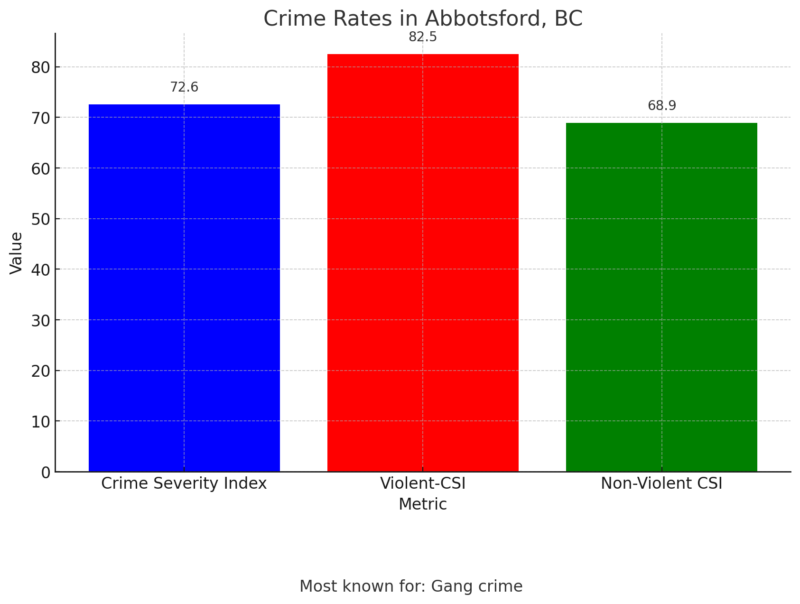
At number 20, we have Abbotsford, a city located in the Lower Mainland of British Columbia. What’s interesting about Abbotsford is that its Crime Severity Index (CSI) is actually below the national average of 73.7. Despite being known for its issues with gang-related crime, Abbotsford ranks lower on the danger scale compared to other cities on our list. This highlights that while it has its challenges, it’s relatively safer in the grand scheme of things.

In Abbotsford, the rate of crime incidents per 100,000 population was 10,783.42 in the past year, marking a modest 0.3% increase from 2021. Additionally, the city’s rate of total people charged per 100,000 population (aged 12 and over) was 1,385, which also represents a slight rise from the previous year according to Mission city records.

Breaking down the numbers further, out of the 522 individuals charged in Abbotsford in 2021, 492 were adults and 30 were youth. These figures provide a detailed view of the crime landscape, highlighting both the prevalence of crime and the demographic distribution of those charged.

19.  Calgary, AB

Calgary, AB Crime Rate Chart

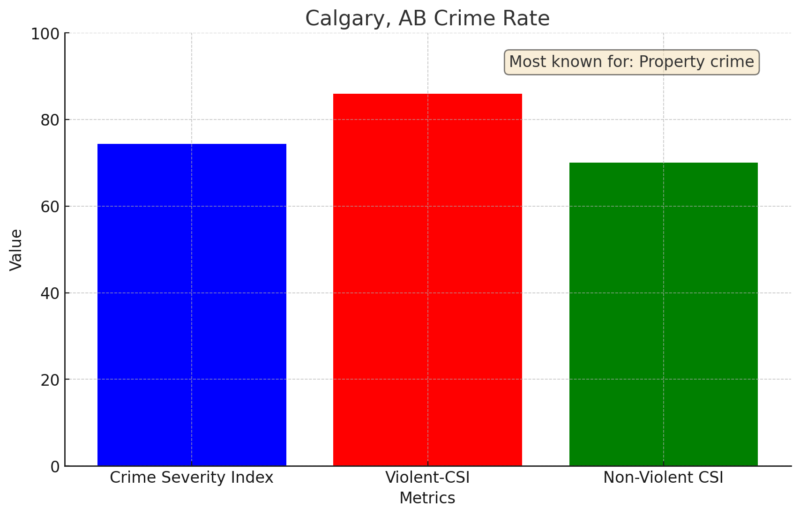
Calgary is the biggest city on our list. If you’re curious about how Montreal, Ottawa, and Toronto stack up against Calgary, Edmonton, Winnipeg, and Vancouver, here’s their CSI:

  • Montreal: 72
  • Ottawa: 50.2
  • Toronto: 56.7

According to Calgary Police Service data, violent crime on transit increased by 15% compared to the previous year, highlighting a concerning trend. Between January and March of 2024, there were 55 reported assaults on Calgary transit systems.

This is a decrease compared to the 71 assaults reported during the same period in 2023. While the overall increase in violent crime is alarming, it’s noteworthy that the number of assaults specifically in transit has seen a decline in the first quarter of 2024. This data underscores the ongoing challenges in ensuring safety on public transportation in Calgary.

18. Burnaby, BC

Crime Rates in Burnaby, BC Chart

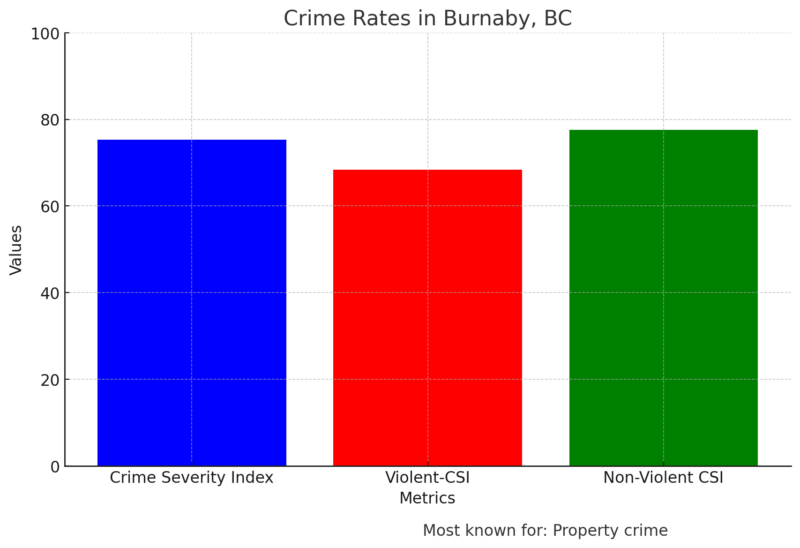
Here’s an interesting aspect about Burnaby: it has a lower rate of violent crime compared to non-violent crime, which sets it apart from some other cities on the list.

One of my friends has lived there for almost 30 years and was quite surprised to see Burnaby make the list. Generally, Burnaby is considered to be a safe place, and many locals share this perception. Despite its inclusion in the top 20, the overall sentiment among residents is that Burnaby remains a relatively secure city to live in.

Burnaby’s total crime rate of 4,350 incidents per 100,000 people is below the provincial average of 6,040 but slightly above the national average of 4,223. Despite having lower rates of both violent (807 per 100,000) and property crimes (3,544 per 100,000) compared to British Columbia as a whole, Burnaby still struggles with a notably low weighted clearance rate of 15%, significantly lower than both the provincial (25%) and national (37%) averages according to Areavibes.

17. Chatham-Kent, ON
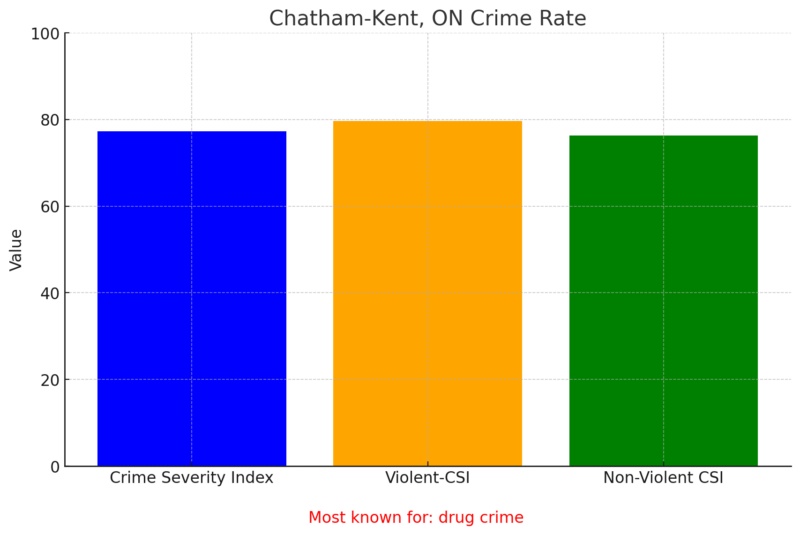
Chatham-Kent, ON Crime Rate Chart

Next up is Chatham-Kent. Nestled near Windsor, this city has nearly equal rates of violent and non-violent crimes. However, drug crime is notably on the rise, reflecting a trend seen across many parts of the country.

Chatham-Kent, Canada, exhibits a moderate safety index of 57.43, indicating a balanced but cautious environment.

While there are high concerns about crime increasing over the past five years (64.25) and significant issues with drug use and dealing (69.59), residents generally feel safe walking alone during daylight hours (74.77) according to Numbeo.

However, safety perception drops considerably at night (45.72), reflecting the community’s mixed experiences with both property and violent crimes.

16. Langley, BC

Langley, BC Crime Rate Chart

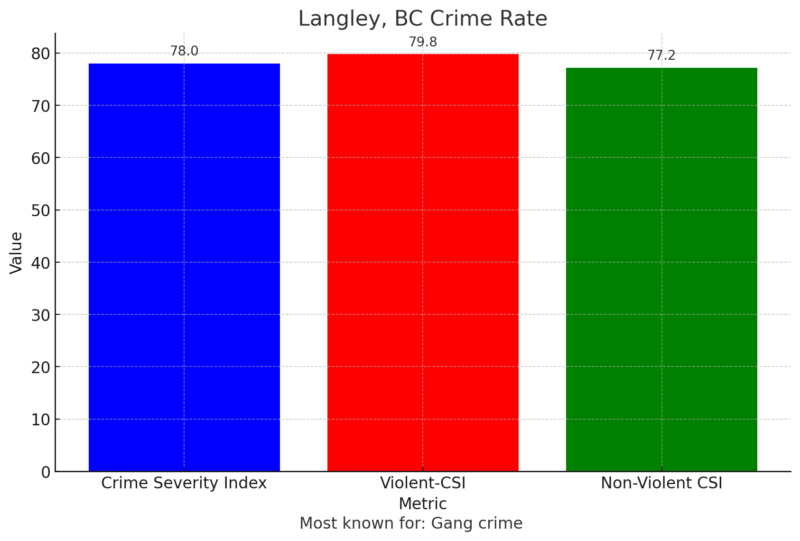
Here we have another city from the Lower Mainland, Langley. What’s interesting about Langley is that the CSI numbers are pretty close across the board. Violent and non-violent crimes are almost evenly matched, so neither one is heavily influencing the overall crime rate.

Langley exhibits a significantly higher total crime rate at 12,986 per 100k people compared to British Columbia and national averages of 6,040 and 4,223, respectively as per this data.

Despite this high crime rate, Langley has seen a notable reduction in the rate of all crime incidents per 100k people, decreasing by 16.7%.

However, its weighted clearance rate for property crimes lags behind, with only 15% cleared compared to the national average of 27%, indicating challenges in addressing less severe crimes.

15. Kitchener-Waterloo, ON

Kitchener-Waterloo Crime Rate Chart

Canada’s tech hub.

Interestingly, in this region, the violent crime rate surpasses the non-violent crime rate. Despite its reputation for innovation and technological advancement, Kitchener-Waterloo faces significant challenges in managing violent crime.

Kitchener, Canada, presents a complex picture when it comes to crime. The city has a Crime Index of 42.01 and a Safety Index of 57.99, indicating a moderate level of crime overall. Over the past five years, crime has significantly increased, with a high percentage (69.98%) of residents acknowledging this trend.

Despite these concerns, worries about specific crimes like mugging, car theft, and physical attacks remain relatively low. However, issues with drug use and property crimes, such as vandalism and theft, are more pronounced.

Residents feel quite safe walking alone during the day (79.27%), though this drops to moderate levels at night (49.40%). This mix of moderate crime levels and specific areas of concern paints a nuanced picture of safety in Kitchener as per Numbeo.

14. Kingston, ON

Kingston, ON Crime Rates Chart

Kingston, the first capital of the colony of Canada, also makes the list. Both violent and non-violent crime rates are quite similar in this historic city.

According to a 2018 report by Statistics Canada, the most prevalent crimes in Kingston are breaking and entering, along with sexual assault.

From 2008 to 2018, the city’s CSI remained largely unchanged, with only a 1% decline over the course of the decade. The decrease of Kingston’s CSI from 2008 to 2018 has a big difference compared to Ontario’s 15% decline during the same time frame.

13. Greater Sudbury, ON

Greater Sudbury, ON Crime Rate Chart

Sudbury, known as the nickel capital of the world, has a high violent crime rate—almost double that of non-violent crime.

Violent crime has continued its multi-year steady increase in Greater Sudbury, reaching a record-breaking 3,222 offences in 2023.

This represents an 11.3% increase (327 cases) compared to 2022, marking the eighth consecutive year that violent crime has risen in the area according to Sudbury.com.

This troubling trend highlights the growing challenges Greater Sudbury faces in curbing violent crime and ensuring community safety.

12. Surrey, BC

Surrey, BC Crime Rate Chart

According to Statscan, Surrey is only #3 among the Lower Mainland cities. Interestingly, the violent and non-violent Crime Severity Index (CSI) numbers are almost identical. This might surprise some, considering Surrey’s history with violent gang-related shootings, especially during the peaks in the ’90s and the occasional spikes since then.

11. Brantford, ON

Brantford, ON Crime Rate Chart

You might recognize Brantford, Ontario as the hometown of hockey legend Wayne Gretzky. But it’s also notable for its high crime rate of 86.4, with violent crime significantly higher than non-violent crime but according to Brantford Police Service among those violent crimes, there were no murders in 2023 but in 2022 there were at least 6 homocides.

10. London, ON

London, ON Crime Rate Chart
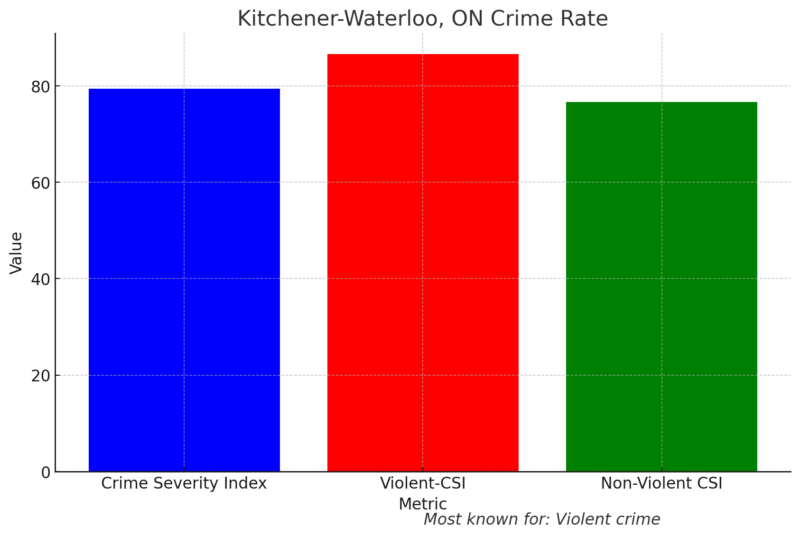
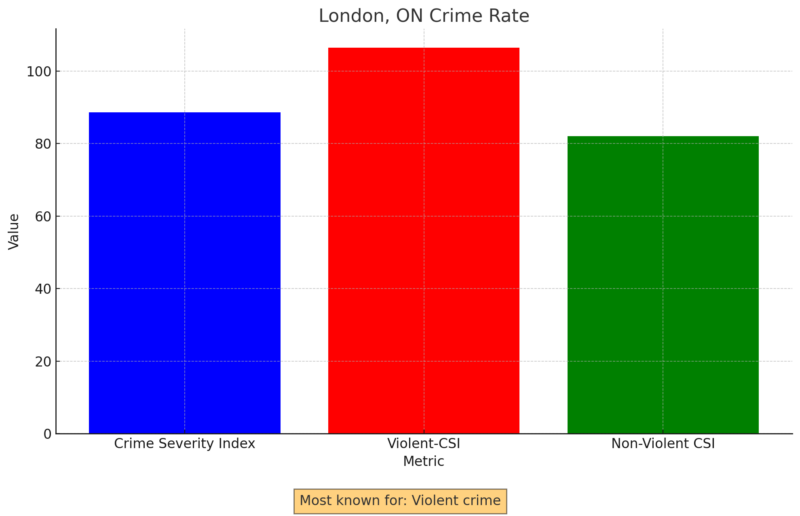
London, situated halfway between Toronto and Windsor. Known for its strong manufacturing sector, London has a violent crime rate that significantly exceeds its non-violent crime rate. Additionally, the city has gained a reputation for frequent bike thefts, adding to its crime concerns.

In April 2024, the City of London Police reported 326 instances of various crimes, including burglary from motor vehicles, commercial robbery, residential burglary, robbery of individuals, theft, and burglary from commercial establishments. This data underscores the persistent crime issues in the city, highlighting the need for ongoing efforts to improve safety and security.

9. Vancouver, BC

Vancouver, BC Crime Rate Chart

If you asked most Canadians which of our three major metro areas had the most crime, many would point to Vancouver. And they’d be right.

Vancouver is a stunning city to visit, but sadly, the crime rates here aren’t so great, much like other cities in the Lower Mainland. There’s a mix of violent and non-violent crime, but according to locals, the biggest issues are related to addiction and drugs.

The astronomical cost of living fuels a tough homelessness problem, especially in areas like the Downtown Eastside, bringing the city’s crime rates up. Vancouver’s crime rate is 8.62 per 1000 residents as per VPD says.

8. Windsor, ON

Windsor, ON Crime Rate Chart

Located at the busiest border crossing between Canada and the U.S., Windsor shows almost equal rates of violent and non-violent crime.

Windsor, Canada, presents a moderate level of crime with a Crime Index of 45.47 and a Safety Index of 54.53.

Over the past five years, crime has notably increased, with 67.54% of residents acknowledging this rise. Specific concerns include moderate worries about property crimes such as home break-ins (43.24%) and theft from cars (49.43%), while violent crimes like assault and armed robbery are also a moderate concern (42.15%).

Drug-related issues are particularly pronounced, with a high problem rating of 73.29%. Despite these concerns, residents generally feel safe walking alone during the day (71.03%), though safety drops to a moderate level at night (42.07%), as per Numbeo website.

7. Edmonton, AB

Edmonton, AB Crime Rate Chart

Of Alberta’s two major cities, Edmonton has the highest crime rate, with a CSI of 106.2. The capital of Alberta also scores high in violent crime.

One of the most encouraging findings is the 7.2% decrease in the overall crime rate.

Despite the drop in the overall crime rate, the crime severity index saw a 4.6% increase.

6. Richmond, BC

Richmond, BC Crime Rate Chart

Richmond, home to Vancouver’s airport. Interestingly, their high overall crime rate is driven by non-violent crime, with a CSI of 121.2.

Their violent CSI, at 66.2, is much lower.

In 2024 so far, Richmond recorded a total of 2,255 index crimes by mid-year, with aggravated assault being the most frequent violent crime at 465 incidents. The city also experienced 619 vehicle thefts and 787 larceny-theft cases, highlighting significant property crime concerns. Notably, homicides were relatively low, with 8 reported cases so far this year.

5. Regina, SK

Regina, SK Crime Rate Chart

Saskatchewan’s capital. Like Winnipeg, Regina has a significantly higher violent crime rate compared to non-violent crime.

In fact, it has the third-highest violent crime CSI on our list.

In Richmond, the most significant crime statistics for 2024 reveal that aggravated assault remains a critical concern with 250 incidents reported.

Property crimes, such as burglary from residences and motor vehicles, are also notable, with 50 and 26 incidents, respectively.

Additionally, the city reported 71 arson cases, emphasizing ongoing challenges in both violent and property crime management.

4. Winnipeg, MB

Winnipeg, MB Crime Rate Chart

Manitoba’s capital city, Winnipeg, has a CSI of 118.5.

There’s a notable disparity between violent and non-violent crime here, with Winnipeg having the second-highest violent crime CSI among the cities on our list.

The data released by Statistics Canada, which measures crime per 100,000 people, shows Winnipeg saw the largest jump in crime severity – 20 per cent – of any other Canadian city from 2021 to 2022.

3. Saskatoon, SK

Saskatoon, SK Crime Rate Chart

The report reveals a significant 65.6% increase in interactions fire crews had with inadequately housed people between 2022 and 2023. Additionally, interactions with encampments nearly doubled during the same period.

The Confederation Suburban area and the Fairhaven community have seen a rise in ‘sharps incidents,’ and overdose incidents spiked dramatically, with fire department calls rising from 289 in 2019 to 1,395 in 2023. The Saskatoon Police Service also reported a record 150,000 calls for service in 2024, marking a 12% increase from 2023.

2. Kelowna, BC

Kelowna, BC Crime Rate Chart

Kelowna is famous for its beautiful scenery, fantastic weather, wine, and orchards – and now, crime. With a CSI of 141.9, it’s the highest in BC, which might surprise locals. Interestingly, their non-violent CSI is much higher than the violent one.

Among Canada’s census metropolitan areas (CMA) in 2023, Kelowna had the highest reported crime rate at 10,532 per 100,000 residents. No other CMA surpassed the 10,000 mark, with Lethbridge coming in second at 9,358 and Winnipeg in third at 8,757. The national average crime rate was significantly lower at 5,668 per 100,000 residents.

1. Red Deer, AB

Red Deer, AB Crime Rate Chart

Taking the top spot is Red Deer, Alberta. Positioned roughly halfway between Calgary and Edmonton, this city is notorious for its “Gasoline Alley.” With a CSI of 176.4, Red Deer leads the list, with both violent and non-violent crime rates being quite high.

According to the Red Deer RCMP’s Quarterly Community Policing Report, property crimes have significantly decreased, while persons crimes have shown a slight increase.

At the city council meeting on Monday, Superintendent Holly Glassford reported that property crimes decreased by 9% compared to the same quarter last year and by 27.8% compared to two years ago, with 1,952 property crime offenses reported in Q3 2023 versus 2,704 in Q3 2021.

This reduction is attributed to multiple checks on prolific offenders, resulting in 43 Criminal Code investigations and the recovery of nine stolen vehicles. However, persons crimes increased by 22% in Q3 compared to last year and by 11% overall from 2022 to 2023.

Most Dangerous Provinces

Wondering about the crime stats by province and territory? We’ve got those too! Here’s the rundown of the overall rate for Canada, followed by each province and territory.

Province/Territory Crime Severity Index
Northwest Territories 391.3
Nunavut 384.1
Yukon 213.3
Saskatchewan 146.8
Manitoba 126.9
Alberta 101.4
British Columbia 92.9
New Brunswick 88.5
Newfoundland and Labrador 75.5
Nova Scotia 71.6
Prince Edward Island 57.0
Ontario 56.2
Quebec 54.3

Among the provinces, Ontario stands out.

Despite having seven cities on our top 20 list, Ontario still has the second-best crime rate among all provinces.

British Columbia, with seven cities on the list as well, is in the middle of the pack.

The territories have very high crime rates, but their small populations mean it doesn’t take much to skew the CSI.

Safest Cities in Canada?

And now for the safest cities in Canada. Here are the top 10, along with their overall CSI:

Region Value
Halton Region 24.0
Terrebonne 28.9
Peel Region 35.2
York Region 39.5
Durham Region 42.5
Laval 47.7
Québec City 48.6
Ottawa 50.2
Longueuil 51.2
Trois-Rivières 52.3
A lot of the Montreal and Toronto regions are represented here. Toronto itself isn’t far from making the list, but Montreal didn’t quite make it into the top 20.

Criteria for Measuring Crime Rates

The Crime Severity Index (CSI)

Crime rates are measured using several key indicators.

The Crime Severity Index (CSI), for instance, accounts for both the volume and seriousness of crimes. Other metrics include the police-reported crime rate, which calculates incidents per 100,000 population.

These indicators are important for understanding the overall level of criminal activity and identifying trends over time.

Specific attention is often given to violent crimes—such as homicides and assaults—as well as non-violent crimes, like theft and fraud.