

Cleveland’s crime rate in 2025? Oh, it’s booming, just not in the way anyone would hope. The city continues to make headlines, but not for its stunning lake views or cultural hot spots. No, Cleveland’s skyrocketing crime rates are what have people talking.
With violent crimes like murder and assault on the rise and property crimes like burglary and car theft happening left and right, it’s no wonder folks are getting a little nervous about their safety.
With all that we know, we want to talk about this subject in greater detail.
So, buckle up, Cleveland’s crime scene is one wild ride.
Key Takeaways
- Cleveland crime rate is 155% above the national average, with 21,574 total reported crimes.
- The violent crime rate (16.27 per 1,000) is well above the national average, with a 1 in 61 chance of being a victim.
- Property crime is also high, with 15,704 incidents and a rate more than double the national average.
- Neighborhoods like Saint Claire-Superior and Industrial Valley have the highest crime rates.
Cleveland Crime Rate Overview
The most dangerous city in America is Cleveland, Ohio. It only had a population of 360,000 yet crime rate is 155% over national average. I’m shocked
Why Cleveland?— Lynn Without an E (@Moon_River05) October 7, 2024
| Statistic | Reported incidents | Cleveland /100k people |
|---|---|---|
| Total crime | 21,574 | 5,931 |
| Murder | 145 | 39.9 |
| Rape | 453 | 124 |
| Robbery | 1,549 | 425 |
| Assault | 3,723 | 1,023 |
| Violent crime | 5,870 | 1,614 |
| Burglary | 3,004 | 825 |
| Theft | 8,728 | 2,399 |
| Vehicle theft | 3,972 | 1,091 |
| Property crime | 15,704 | 4,317 |
Cleveland’s crime rate in 2025 presents a troubling situation for both residents and visitors, with a total crime rate of 59.31 per 100k residents, according to an AreaVibes report.
We can see that this results in the city having a 155% higher crime rate than the national average.
The elevated crime rate has negatively impacted public perception of Cleveland, with many viewing the city as one of the least safe in the U.S.
These troubling figures place Cleveland in a vulnerable position as it struggles to manage ongoing criminal activity.
Despite efforts to reduce crime, the data signals a pressing need for continued intervention and proactive strategies to improve safety across the city.
Violent Crime in Cleveland
The total number of violent crimes reported this year in Cleveland stands at 5,884, resulting in a crime rate of 16.27 per 1,000 residents, as we can see in the NeighborhoodScout report.
The report shows slightly different numbers than the one we could see in AreaVibes.
This figure far exceeds the national average of 4 per 1,000 residents, making Cleveland a high-risk area for violent offenses. Among the most concerning categories of violent crime are:
| Statistic | Report Total | Rate per 1,000 |
|---|---|---|
| Murder | 145 | 0.40 |
| Rape | 453 | 1.25 |
| Robbery | 1,555 | 4.30 |
| Assault | 3,731 | 10.32 |
These statistics suggest that the likelihood of becoming a victim of violent crime in Cleveland is notably high. In fact, the chances of being a victim of violent crime are 1 in 61.
In a report released by News5Cleveland, we can see that, in 2023, Cleveland murder rates were 13.46% higher than in 2022. It is important to know this is a completely different trend from most cities in the country, where the rates are dropping.
When compared to the overall state of Ohio, Cleveland’s violent crime rates are significantly higher. Furthermore, the local rates are 366% higher than the national average.
The city’s high levels of violent crime have made it one of the more dangerous urban areas in the region, and residents must remain vigilant to avoid becoming part of these statistics.
Property Crime in Cleveland
The previously mentioned NeighborhoodScout report tells us that local property crime is a major concern in Cleveland, with the total number of cases reported reaching 15,779.
It results in a property crime rate of 43.64 per 1,000 residents, more than double the national average of 20 per 1,000.
- The prevalence of property crimes, including burglary, theft, and motor vehicle theft.
- A burglary occurs at a rate of 8.31 per 1,000 residents, making it one of the most common property crimes in Cleveland.
- Theft, the most frequent category of property crime, happens at a rate of 24.34 per 1,000 residents.
- Motor vehicle theft is also a notable concern, with 10.99 cases per 1,000 residents.
These alarming figures indicate that property crimes are widespread across Cleveland, impacting various neighborhoods and social groups.
The risk of becoming a victim of property crime in Cleveland is significantly higher than in other parts of Ohio.
Residents have a 1 in 23 chance of falling prey to property-related offenses, emphasizing the importance of securing personal belongings and property in the city’s high-crime areas.
Crime in Cleveland Neighborhoods
Cleveland’s crime rates vary significantly across its many neighborhoods, with some areas experiencing far higher levels of criminal activity than others.
While certain neighborhoods are relatively safer, others are plagued by persistent issues with both violent and property crimes.
The most dangerous neighborhoods, according to PropertyClub, are:
| Neighborhood | Crime Rate Compared to National Average | Common Crimes |
|---|---|---|
| Saint Claire-Superior | +451% | Gang activity, homicide, drug trafficking, prostitution, robbery, and property crimes |
| Industrial Valley | +291% | High violent crime rates, especially murder, urban decay, limited employment opportunities |
| North Broadway | +264% | Murders, assaults, shootings, robberies, high poverty, theft |
| Woodland Hills | +257% | High violent and property crimes |
| Kinsman | +251% | Gang activity, drug trafficking, theft, prostitution |
| Union-Miles Park | +228% | Shootings, homicides, property crimes, low household income |
| Clark-Fulton | +221% | High violent crime rate, robbery, theft |
| Buckeye-Shaker | +125% | Robbery, homicide, burglary, limited employment opportunities |
| Stockyards | +40% | Gang activity, poverty, high violent crime rate |
| Fairfax | +39% | Robbery, assault, burglary, homicide, gang activity |
Comparison to Nearby Cities
When comparing Cleveland’s crime rate to other nearby cities, Cleveland stands out as one of the most dangerous urban areas in the region.
The city’s crime rates, particularly for violent crimes and property crimes, are significantly higher than those in neighboring cities, creating a stark contrast.
Detroit

Known for its own struggles with crime, Detroit has a total crime rate of 66.09 per 1,000 people, which is slightly higher than Cleveland.
Detroit has historically battled with high levels of violent crime, driven largely by gang activity and economic challenges, but it remains comparable to Cleveland in terms of overall crime rates.
Boston

Boston’s crime rate, 26.19, is significantly lower than Cleveland’s.
Boston has seen improvements in public safety over the years due to heavy investments in community policing and public safety initiatives.
Buffalo

Buffalo, another Rust Belt city with similar socioeconomic issues, has a total crime rate of 40.88 per 1,000 people. While this is still high, it is noticeably lower than Cleveland’s rate.
Buffalo has made strides in reducing violent crime and has implemented community programs to address gang violence, which has contributed to its relative improvement compared to Cleveland.
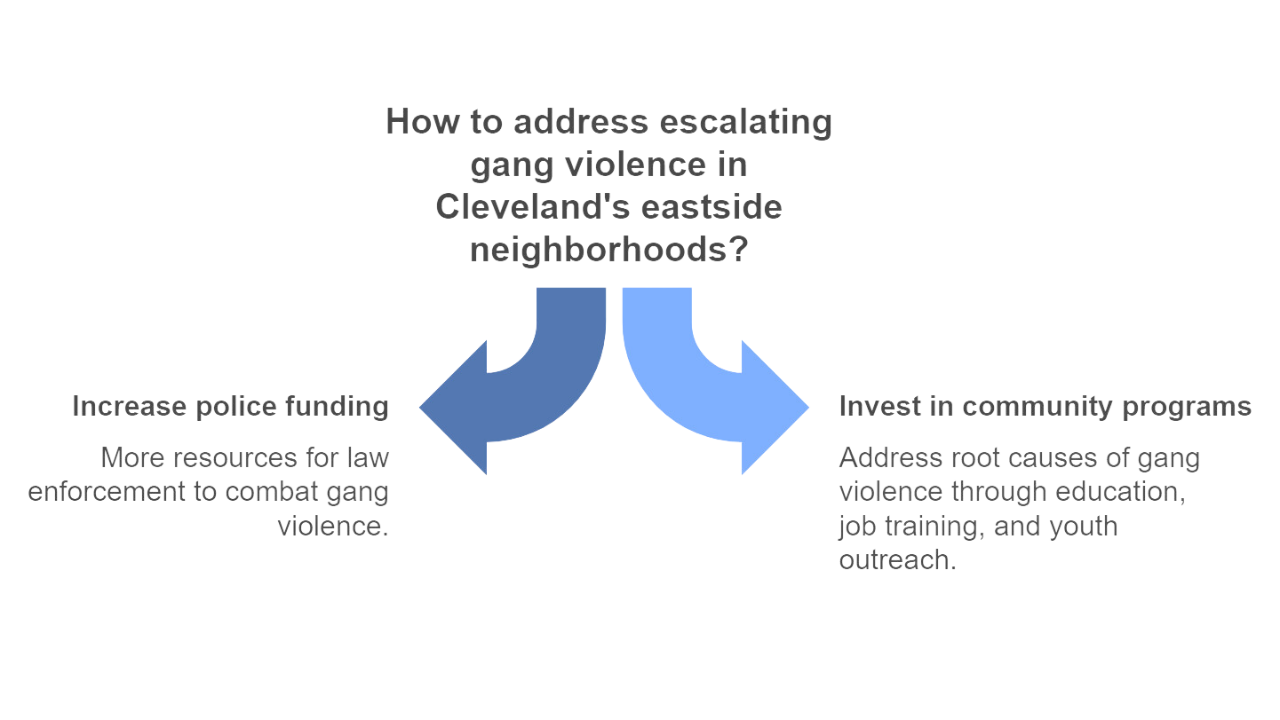
Gang Activity and Police Funding Problems in Cleveland
Cleveland continues to grapple with escalating gang violence, especially in its eastside neighborhoods.
Violent turf wars between rival gangs, like the Benham Boyz and 103 Murda Block, have led to numerous deaths, including both gang members and innocent bystanders.
Memorials of balloons, candles, and posters are a frequent sight, symbolizing the persistent grief that plagues the city.
Escalating Gang Violence
Rivalries between gangs like the Benham Boyz and 103 Murda Block have fueled deadly drive-by shootings, claiming both gang members and innocent lives.
Children have tragically been caught in the crossfire, with victims like 5-month-old Aavielle Wakefield and 3-year-old Major Howard highlighting the devastating impact on the community.
Neighborhoods are dotted with memorials, spontaneous sites of grief and remembrance, indicating the pervasive gang violence in the city.
- Drug trafficking
- Armed robbery
- Murder
Police Funding Challenges
Cleveland’s police department faces significant obstacles in addressing gang violence, mainly due to budget cuts and staff shortages.
Recent reductions in the city’s budget have led to fewer vacant police positions being filled, limiting the department’s ability to respond effectively to gang-related violence.
Despite raising officer pay to attract recruits, the department still struggles with recruitment and retention, creating gaps in law enforcement coverage.
Cleveland’s police department has been under federal oversight since high-profile incidents of excessive force, which has cost the city millions in compliance.
With limited financial support, Cleveland has been forced to divert resources away from proactive solutions, which hampers long-term efforts to curb gang activity.
Cleveland crime rates drop from last spring, so what’s actually making a difference? https://t.co/gn9S1dV6XS
— News 5 Cleveland (@WEWS) May 16, 2024
Methodology
The methodology for compiling this report on Cleveland’s crime rate in 2025 follows several key steps. First, we thoroughly reviewed reliable crime data sources, including public databases like AreaVibes and NeighborhoodScout, along with reports from local news outlets such as News5Cleveland.
After collecting the raw data, we organized the crime statistics in a way that is both informative and easy to interpret. We categorized the data into relevant sections, such as violent crime, property crime, and crime rates in specific neighborhoods.
In addition to gathering and organizing data, we compared Cleveland’s crime rates with those in nearby cities like Detroit, Boston, and Buffalo to provide regional context. These comparisons helped us illustrate Cleveland’s position relative to other cities facing similar socioeconomic challenges.
The comparison process also revealed trends, such as Cleveland’s notably higher violent crime rate, which we explored further.
Furthermore, we added qualitative insights by analyzing reports on local issues that contribute to the crime rate, including gang violence and police funding challenges. We closely examined sources discussing gang activity and law enforcement difficulties to offer a well-rounded understanding of the factors driving crime in the city.
The Bottom Line
Cleveland crime rate remains one of the highest in Ohio in 2025, with both violent and property crimes posing significant threats to residents and visitors.
Despite some efforts to combat criminal activity, the city’s crime rates remain high, making safety a major concern.
It is crucial for those living in or visiting Cleveland to stay vigilant and aware of their surroundings to reduce the risk of becoming a crime victim.
Sources
- AreaVibes – Cleveland, OH Crime Rates
- Cleveland – 2 Ohio cities rank among bottom of safest in the U.S., analysis claims
- ClevelandMagazine – Cleveland’s Safety Numbers: Inside the Stats and the Plans for Change
- NeighborhoodScout – Cleveland, OH
- News5Cleveland – Murder rates are falling in U.S. cities. But not in Cleveland.
- TheZebra – 10 worst cities for house crime
- PropertyClub – Most Dangerous Neighborhoods in Cleveland
- CleveScene – The Story of Cleveland’s Gang Violence Is Written Chapter By Chapter with Balloons, Posters and Candles on the City’s Streets
- IdeaStream – Cleveland Gangs Part 1
- SignalCleveland – New Cleveland budget cuts more vacant police jobs as city raises officer pay
- TheMarshallProject – Federal Oversight of Police Has Cost Cleveland Millions. What’s Changed?