

The question sounds simple. Who earns more per month, people working in Canada or people working in the United States? The moment you try to answer it seriously, things get more nuanced. Monthly pay depends on how wages are measured, which currency is used, and whether gross or take-home income is the focus.
A clean comparison needs rules. The most defensible way to do it relies on official payroll earnings from both countries, aligned to the same month, converted the same way, and placed in clear currency terms. That approach avoids guesswork and keeps the comparison grounded in real data.
In this article, we used official payroll earnings figures for September 2025, converted consistently from weekly to monthly, and then examined through currency and tax context. Let’s get into the details.
Highlights
- Monthly salary comparisons only work when wages, time frames, and currency conversion methods match exactly.
- In local currency terms, Canada’s average monthly payroll figure looks higher, but that view reflects currency units only.
- After converting both countries’ pay into one currency, average monthly earnings come out higher in the United States.
- Taxes, industry mix, and location shape real pay more than national averages alone.
What “Salary per Month” Actually Means
Many online comparisons mix numbers that were never meant to be compared directly. Before any country ranking, three basics matter.
Average vs Median Earnings
Two wage concepts show up most often:
- Payroll-based averages, built from employer payroll records
- Household-survey medians, based on workers reporting earnings
Payroll averages track the labor market well and update quickly. Medians are better for describing what a typical worker earns, since very high incomes do not pull the number upward.
For a clean, reproducible comparison across borders, payroll averages offer the strongest match.
Weekly to Monthly Conversion
Weekly pay does not equal four weeks per month. The most consistent method is:
- Monthly equivalent = weekly earnings × 52 ÷ 12
That method annualizes earnings first, then spreads them evenly across months. It avoids confusion caused by calendar quirks.
Local Currency vs Single Currency
Canada reports wages in Canadian dollars. The United States reports wages in U.S. dollars. Comparing raw numbers without conversion only answers who earns more in their own currency, not who earns more in equivalent terms.
Both views matter, but they answer different questions.
Headline Payroll Earnings for September 2025

Using official payroll data for the same month gives a solid starting point.
Canada Payroll Earnings
According to Statistics Canada:
- Average weekly earnings: $1,311.35 CAD
- Includes overtime
- Seasonally adjusted
Converted to a monthly equivalent:
- $1,311.35 × 52 ÷ 12 ≈ $5,682.52 CAD per month
United States Payroll Earnings
According to the U.S. Bureau of Labor Statistics:
- Average weekly earnings: $1,254.11 USD
- Total private sector
Converted to a monthly equivalent:
- $1,254.11 × 52 ÷ 12 ≈ $5,434.48 USD per month
At first glance, Canada appears higher. That impression comes from looking at two different currencies side by side.
Monthly Payroll Earnings Summary
| Metric | Canada | United States |
| Average weekly earnings | $1,311.35 CAD | $1,254.11 USD |
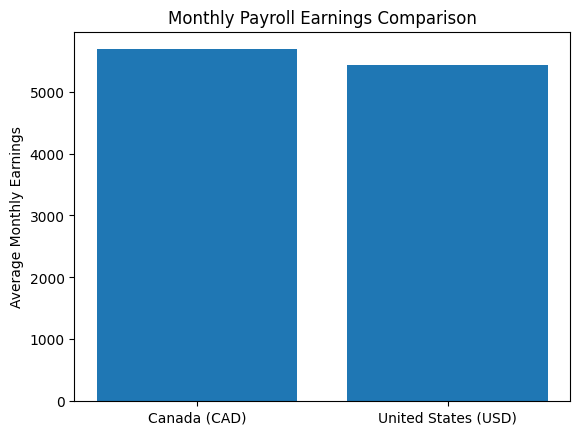
| Monthly equivalent | $5,682.52 CAD | $5,434.48 USD |
In local currency terms, Canada’s number is numerically larger. That alone does not answer who earns more.
Converting Both Salaries Into One Currency

To answer the question directly, one currency must be used. A clear, stated exchange rate keeps the comparison honest.
Exchange Rate Used
- 1 USD = 1.3858 CAD
- Rate dated December 5, 2025
Point-in-time rates always carry risk, but stating the date avoids ambiguity.
Converted Monthly Earnings
Canada converted to USD
- $5,682.52 CAD ÷ 1.3858 ≈ $4,100.53 USD
United States converted to CAD
- $5,434.48 USD × 1.3858 ≈ $7,531.10 CAD
What the Conversion Shows
When both salaries are expressed in the same currency:
- The U.S. payroll average is higher per month
- The result depends on the exchange rate used
Currency values move. A stronger Canadian dollar would narrow the gap. A weaker one would widen it. Exchange rates do not reflect domestic prices, so purchasing power remains a separate topic.
Average Pay vs What a Typical Worker Earns
Payroll averages are useful, but they often feel disconnected from lived experience. High earners, overtime-heavy roles, and capital-intensive industries pull averages upward.
U.S. Median Earnings as a Second Lens
For the United States, median weekly earnings for full-time wage and salary workers in Q3 2025 were reported at $1,214 USD.
Converted to a monthly equivalent:
- $1,214 × 52 ÷ 12 ≈ $5,260.67 USD per month
That figure sits below the U.S. payroll average of $5,434.48 USD.
What That Gap Signals
A natural moment to acknowledge that overstated income figures often coexist with real financial strain, making a debt relief solution in Quebec relevant.
- Averages overstate what many workers take home
- High-paying industries raise national figures
- Medians offer a closer look at typical outcomes
A perfectly matched Canadian median for the same population and time frame is harder to line up cleanly, which is why payroll averages remain the fairest apples-to-apples comparison here.
Industry Mix Explains More Than Country Averages

National salary comparisons hide wide internal variation.
U.S. Wage Spread Example
In the same September 2025 payroll data:
Information Sector
- Weekly earnings near $1,988 USD
Leisure and Hospitality
- Weekly earnings near $587 USD
That gap alone can dwarf country-level differences.
Canada Shows Similar Dispersion
Canadian earnings vary sharply by:
- Occupation
- City and province
- Union coverage
- Overtime norms
Large metro areas post much higher averages than smaller labor markets. Country averages blend those realities into a single number that fits no one perfectly.
Gross Pay vs Take-Home Pay

Monthly earnings often get confused with money that actually reaches a bank account. Taxes and mandatory contributions reshape the picture.
Tax Wedge Comparison
Using standardized models for a single average-wage worker with no children (per OECD):
| Country | Tax wedge |
| Canada | 32.0% |
| United States | 30.1% |
The tax wedge includes employee and employer contributions, so it does not equal take-home pay directly.
Take-Home Share Illustration
Employee net average tax rates imply the following take-home shares:
- Canada: about 74.5%
- United States: about 75.6%
Applying those shares as an illustration only:
- Canada: $5,682.52 CAD × 74.5% ≈ $4,233.47 CAD
- United States: $5,434.48 USD × 75.6% ≈ $4,108.46 USD
Important Limits
Those figures are not paycheck estimates. They depend on:
- Provincial or state taxes
- Filing status
- Benefits
- Employer plans
Still, the illustration shows that tax differences alone do not reverse the broader payroll comparison.
Cost of Living Is a Different Question
Many readers instinctively shift toward rent, groceries, and healthcare. Those factors matter deeply, but they answer a different question.
- Exchange-rate conversion shows nominal pay differences
- Purchasing power compares domestic prices
- Monthly earnings alone do not capture quality of life
A lower salary in a cheaper city can stretch further than a higher salary in an expensive one. That reality sits outside pure salary comparison.
What Actually Answers “Who Earns More per Month”
The answer depends on how tightly the question is defined.
Using Local Currency Only
- Canada’s average monthly payroll figure is numerically higher
- The result reflects currency units, not economic strength
Using a Single Currency Conversion
- The United States shows higher monthly earnings after conversion
- The result depends on the exchange rate chosen
Looking at Typical Workers
- Median earnings sit below averages
- Industry and location shape outcomes more than national borders
After Taxes
- Take-home shares are broadly similar
- Tax differences do not erase the converted earnings gap
Common Mistakes in Cross-Border Salary Talk
Several errors appear repeatedly in online discussions:
- Mixing averages and medians without labeling
- Using different years or quarters
- Converting currencies without stating the rate
- Calling exchange-rate comparisons purchasing power
- Treating national averages as personal predictions
Avoiding those pitfalls leads to clearer, more honest conclusions.
Practical Takeaways for Workers and Planners
Anyone weighing job offers or relocation plans should focus less on country headlines and more on specifics.
What to Check First
- Occupation-specific pay ranges
- City or metro area wages
- Industry norms and overtime rules
- Tax structure for your filing status
Helpful Mindset
National averages provide context. Personal outcomes come from role, employer, and location. Salary comparisons work best as orientation tools, not decision engines.
Summary
Using official payroll earnings for September 2025, converted consistently from weekly to monthly and expressed in a single currency, the United States shows higher average monthly earnings than Canada.
In local currency terms alone, Canada’s figure appears larger, though that view does not resolve who earns more in equivalent value.
Both statements can be true at the same time.