
Crime rates in major cities are a significant concern for residents and visitors due to higher population densities and unique social issues.
In 2025, it’s important to compare crime rates across different cities to understand their safety and develop effective prevention strategies.
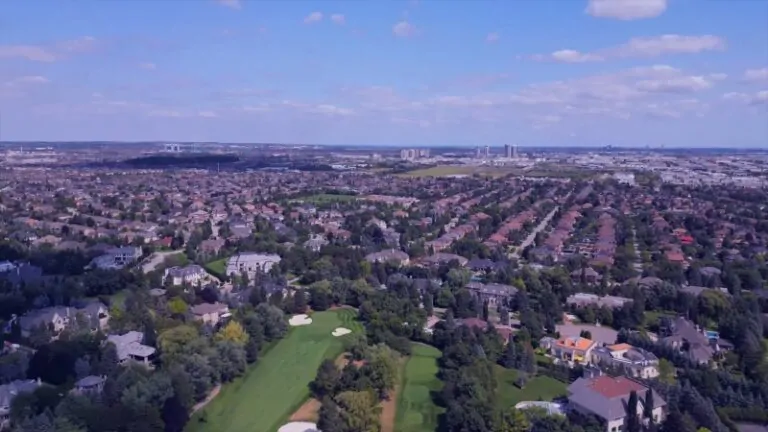
Vancouver, a major city in British Columbia, Canada, has seen changes in its crime rates over the years.
To assess Vancouver’s safety, we need to compare its current crime rate with other major cities.
Analyzing recent data will help us understand Vancouver’s safety status and identify areas for improvement in law enforcement.
Comparative Overview of Crime Rate and Statistics
Vancouver Crime Trends
The Vancouver Police Department has released a new online dashboard, intended to enhance community awareness of crime trends and to help prevent crime in Vancouver. Meet #GeoDASH! https://t.co/i1YmymtN2p #VPD #Community #CrimePrevention pic.twitter.com/FklQD9s2Vf
— Vancouver Police (@VancouverPD) December 4, 2018
In recent years, Vancouver has experienced fluctuations in its crime rates.
According to the Vancouver Police Department Crime Incident and Crime Rate Statistics, there have been changes in crime rates across various categories, such as violent crime and other types of crime.
In 2023, Vancouver’s crime data highlights several key issues.
The violent crime rate was 8.62, with assaults being particularly high at 6.77. Property crimes had a significant impact, with a rate of 46.55, and theft from auto incidents were notably frequent at 9.88.
Fraud cases were also concerning, with a rate of 4.94. These statistics provide a clear picture of the most critical crime problems in Vancouver for 2023.
Comparison with London, UK
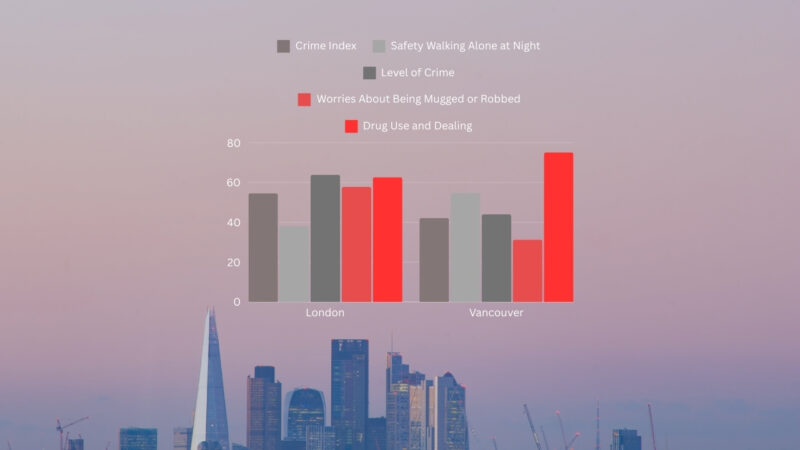
In comparing Vancouver and London, several key crime rates highlight important aspects of safety in both cities according to Numbeo:
Overall Crime Index
- Vancouver: 42.20
- London: 54.60
This indicates a generally safer environment in Vancouver.
Safety Walking Alone at Night
- Vancouver: 54.78
- London: 38.19
Vancouver feels safer for residents walking alone at night.
Level of Crime
- Vancouver: 43.94 (Moderate)
- London: 63.89 (High)
Worries About Being Mugged or Robbed
- Vancouver: 31.24 (Low)
- London: 57.78 (Moderate)
Problem with Drug Use and Dealing
- Vancouver: 75.09 (High)
- London: 62.70 (High)
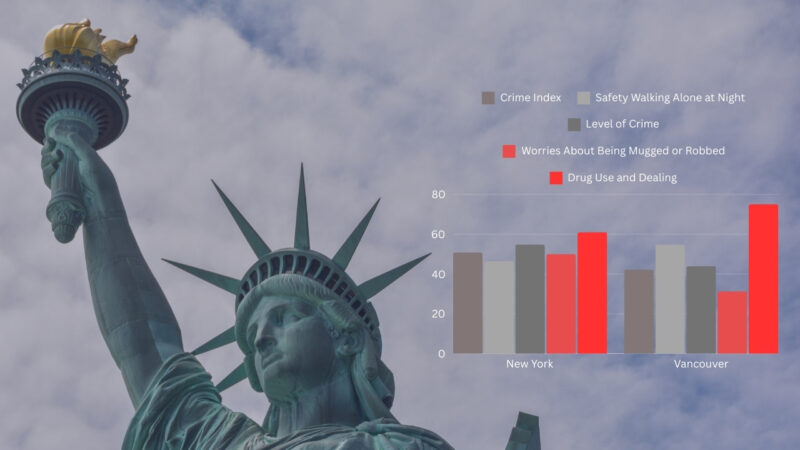
Comparison with New York
Comparison with Belgrade, Serbia
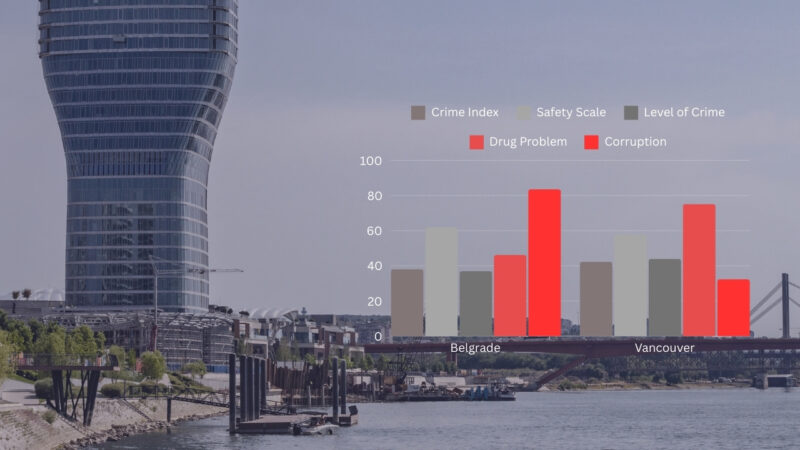
Belgrade, Serbia, and Vancouver have relatively similar crime rates, with both cities experiencing fluctuations in recent years.
According to the Crime Index, certain aspects such as property crime are higher in Vancouver, while Belgrade sees more issues with corruption and bribery.
| City | Crime Index | Safety Scale | Level of Crime | Drug Problem | Corruption |
|---|---|---|---|---|---|
| Vancouver | 42.20 | 57.80 | Moderate (43.94) | High (75.09) | Low (32.25) |
| Belgrade | 38.01 | 61.99 | Low (36.98) | Moderate (46.16) | Very High (83.50) |
Comparison with São Paulo, Brazil
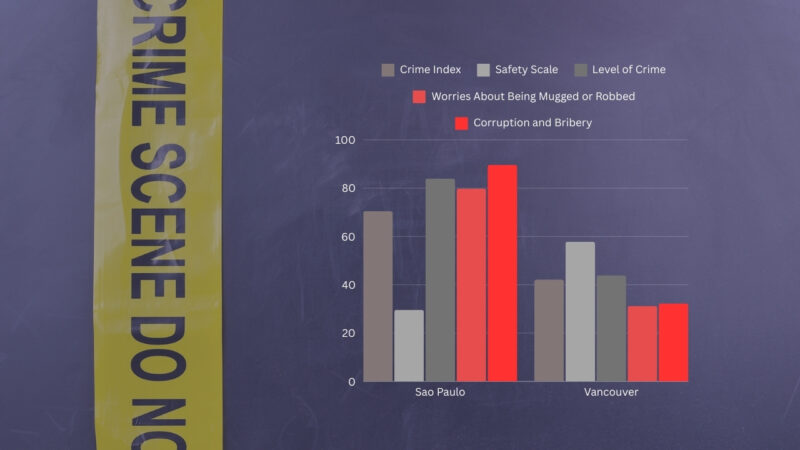
São Paulo’s crime rate is notably higher than Vancouver’s.
The city suffers from higher rates of violence and often experiences issues with gang-related crime, impacting the overall safety of the city.
Vancouver’s crime rates remain lower in comparison, as detailed in the crime reports.
Crime Index
- Sao Paulo: 70.43
- Vancouver: 42.20
Vancouver has a significantly lower crime index, indicating it is generally safer than Sao Paulo.
Safety Scale
- Sao Paulo: 29.57
- Vancouver: 57.80
Vancouver scores higher on the safety scale, reflecting a better sense of security.
Level of Crime
- Sao Paulo: Very High (83.93)
- Vancouver: Moderate (43.94)
Crime levels are perceived to be much higher in Sao Paulo compared to Vancouver.
Worries About Being Mugged or Robbed
- Sao Paulo: High (79.78)
- Vancouver: Low (31.24)
Concerns about being mugged or robbed are significantly lower in Vancouver.
Problem with Corruption and Bribery
- Sao Paulo: Very High (89.64)
- Vancouver: Low (32.25)
Corruption and bribery are significant issues in Sao Paulo compared to Vancouver.
Methodology for This Analysis

Data Sources
In order to carry out a comprehensive crime rate analysis for Vancouver and other major cities in 2024, we have utilized multiple data sources. The primary source Numbeo, but also the Federal Bureau of Investigation (FBI) annual crime report, which provides data on crime at the national, state, and local levels.
For Vancouver specifically, we rely same on Numbeo and on the Vancouver Police Department’s Crime Incident and Crime Rate Statistics. These sources provide a solid foundation for comparing crime rates between major cities.
Statistical Methods
From the data obtained, we employed the following statistical methods to analyze and compare crime rates:
- Descriptive Statistics: Calculation of measures of central tendency (mean, median, and mode) and dispersion (range, variance, and standard deviation) for each type of crime, city-wise and category-wise.
- Crime Rate per 1,000 Population: The comparison of crime rates was done on the basis of crimes per 1,000 population to account for differences in population size across cities.
- Normalization and Indexing: To compare trends across multiple cities and types of crime, data was normalized and indexed to base year 2019 for easy comparison of trends.
- Trend Analysis: Linear regression was used to identify any significant trends in crime rates over the years, with particular emphasis on the 2019-2024 period.
Key statistics about Edmonton’s crime rate were also highlighted to provide a specific case study within the broader analysis.
Limitations of Analysis

It is important to mention some limitations of this analysis, which include:
- Data Incompleteness: Despite the use of reliable sources, there may still be gaps in the available data due to differences in reporting standards and methodologies across cities.
- Variation in Crime Definitions: Some cities may have slightly different definitions or categorizations for certain types of crime, resulting in disparities in the data.
- Influence of External Factors: The analysis does not take into account potential external factors (economic, social, political) that might have influenced crime rates during the studied period.
By acknowledging these limitations, we aim to provide a clear and informative comparison of crime rates in Vancouver and other major cities in 2024.