10 Key Statistics on Vancouver’s Crime Rate in 2024

Vancouver's Crime Rate in 2024

Share Post:

Vancouver’s crime scene has had its ups and downs in 2024. Some areas got worse, while others showed a bit of promise.

The latest report from the Vancouver Police Department gives us the lowdown on the shifts in crime types, like fraud and drug-related offenses.

When you stack Vancouver’s crime rates against other big cities, some interesting trends pop up.

Crime Rate in 2024

Vancouver's Crime Rate in 2024

Vancouver’s crime rate has seen changes over recent years, particularly in certain types of crime.

In 2024, violent crime incidents in the city, recorded by the Vancouver Police Department, showed increases in Districts D2 and D4 compared to previous years.

The year-to-date statistics reveal a 6.2% rise in violent crime citywide.

For example, in March 2024, there were significant upswings in violent crime in these districts.

Comparison to National Averages

Analyzing Vancouver’s crime rates alongside national averages offers a clearer perspective on its relative safety.

Vancouver’s violent crime rate was higher than some other major Canadian cities in 2024, particularly in terms of assaults which stood out with a rate of 8.62 incidents per 1,000 population.

10 Key Statistics

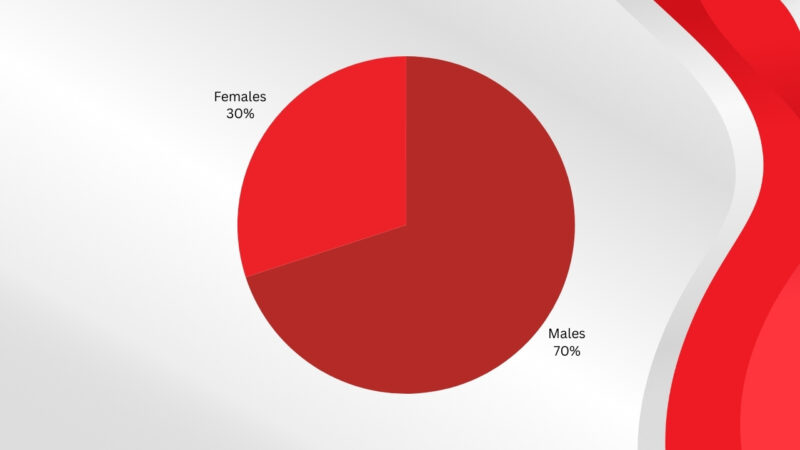
1. Violent Crime Rates

Violent Crime Rates in Vancouver

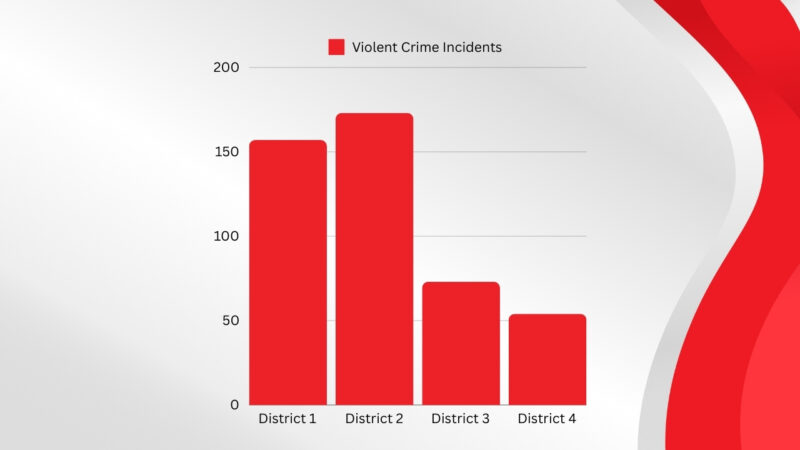
In 2024, the Vancouver Police Department recorded notable variations in violent crimes across different districts. Violent crime incidents saw changes, with certain areas experiencing increases while others saw declines.

Additionally, assaults remain a significant portion of these figures.

Vancouver’s homicide rate stands at 2.1 per 100,000 population.

2. Property Crime Rates

With a population of 194,512, residents face a 1 in 18 chance of becoming a victim of property crime. The data shows that burglary incidents total 1,351, resulting in a rate of 6.95 per 1,000 residents. Theft is notably prevalent, with 6,625 reported cases, leading to a rate of 34.06 per 1,000 residents.

Motor vehicle theft is also a major issue, with 2,801 incidents, equating to a rate of 14.40 per 1,000 residents. These figures highlight the urgent need for improved security measures and effective crime prevention strategies in Vancouver according to NeighborhoodScout.

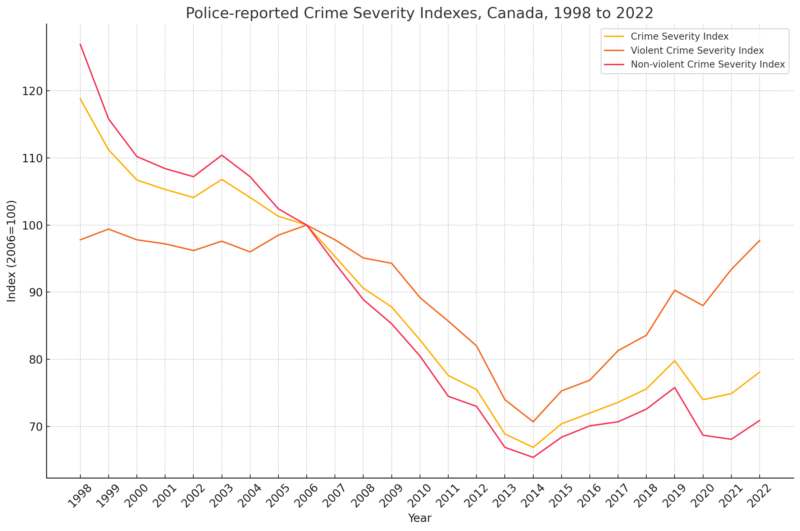
3. Crime Severity Index

Police-Reported Crime Severity Indexes, Canada, 1998 to 2022

Vancouver’s “crime severity index” (CSI) remains higher than the national average, though police have observed double-digit decreases over the past decade. The CSI measures the severity and impact of crimes, with more serious offenses carrying greater weight, calculated using sentencing data from Canada’s courts.

According to Statistics Canada, Vancouver’s violent CSI has decreased by 3.6% since 2013, while the national violent CSI increased by 32.0% from 2013 to 2022. Additionally, Vancouver’s non-violent CSI has dropped by 15.2% over the past decade, contrasting with a 6% rise in the national average.

These trends highlight Vancouver’s progress in reducing crime severity despite remaining above the national average.

4. Increase in Fraud and Financial Crimes

Reports of fraud and financial crimes in Vancouver have surged by 18% this year, indicating a growing concern for economic security among residents according to Worldmetrics.

5. Rise in Cybercrime

Cybercrime incidents have risen sharply, with a 25% increase in the last year. This trend highlights the need for enhanced cybersecurity measures and public awareness as per the same source as above.

6. Drug-Related Crime Surge

Drug-Related Crimes in Vancouver

Drug-related crimes have increased by 15% over the past two years, pointing to a critical area for law enforcement and community intervention.

7. Age Groups

Vancouver’s crime data reveals distinct trends among different age groups. Young adults, particularly those aged 18-24, have shown a notable increase in crime rates, predominantly in theft and vandalism.

In contrast, the age group of 25-34 demonstrates a higher incidence of drug-related offenses. Elderly populations, particularly those over 65, report the lowest crime involvement, primarily limited to minor property crimes.

Youth crime, encompassing individuals under 18, has shown a decline, which could be attributed to focused community programs and school initiatives. This reduction may reflect the effectiveness of preventive measures that are geographically and demographically targeted. The variance across age groups highlights the necessity for age-specific strategies in crime prevention.

8. Crime by Gender

Crime by Gender in Vancouver

Gender demographics show clear differences in crime patterns. Males account for a larger proportion of crime, particularly in violent offenses such as assaults and homicides. According to recent Vancouver Police Department statistics, men are involved in over 70% of documented violent crimes.

In contrast, females show higher involvement in non-violent crimes, like fraud and drug-related offenses. Despite an overall lower crime rate, female involvement in these types of crime has seen a slight increase.

Efforts to address gender-specific crime trends often include tailored intervention programs, aiming to reduce recidivism among different genders by addressing the underlying causes and social factors. This demographic analysis underscores the importance of targeted crime prevention efforts.

9. High-Risk Areas

Certain districts in Vancouver have experienced more crime incidents. District 1 (D1) and District 2 (D2) showed notable increases in specific crime categories. According to April 2024 Crime Incident Statistics report we mentioned above, violent crimes have surged by 6.1% in D1 and 10.6% in D3 compared to the previous year.

10. Safest Neighborhoods

In contrast, other districts like District 4 (D4) observed a decline in crime rates. April 2024 data indicates a 19.4% decrease in violent crimes in D4, making it one of the safer neighborhoods.

Lower crime rates in these areas can be attributed to several factors, including effective community policing and preventive measures. These neighborhoods often benefit from higher socio-economic conditions, contributing to overall safety.

Vancouver’s interactive crime mapping tools also allow residents to view the safety levels specific to their neighborhoods, offering a user-friendly way to stay informed about local crime trends.

About Us

We’re dedicated to providing clear, fact-based reporting to help you make sense of the numbers and their impact on our communities…