Markham’s population in 2025 is approximately 360,000 to 365,000 residents, with a demographic profile defined by a large working-age population, a median age in the low-40s, and households that remain predominantly family-based.
The most reliable foundation for this assessment comes from the 2021 Census, combined with municipal and regional population estimates used for planning between censuses.
While 2025 does not yet have a full census-style age and household breakdown, the structure of Markham’s population is well understood and has not shifted abruptly since 2021.
Population Baseline Markham Enters 2025 With
Markham is one of the largest municipalities in York Region and has experienced steady, incremental growth rather than sudden population surges. The 2021 Census recorded 351,261 residents in the City of Markham.
Since then, municipal planning documents and demographic tracking place the city in the low-to-mid 360,000 range by 2024–2025, reflecting continued but moderating growth as greenfield development declines.
| Reference point | Population | Context |
| 2016 Census | ~328,900 | Pre-intensification baseline |
| 2021 Census | 351,261 | Most recent full demographic count |
| 2024–2025 estimate | ~360,000–365,000 | Municipal and regional planning estimates |
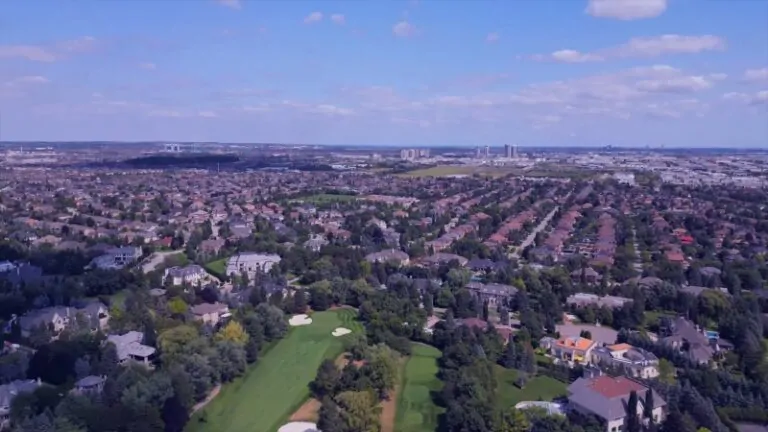
This positions Markham as a large, mature suburban city where population growth is increasingly tied to intensification, redevelopment, and immigration rather than large-scale suburban expansion.
Age Structure – What the Latest Detailed Data Shows
The 2021 Census remains the authoritative source for Markham’s age breakdown.
While absolute numbers have grown since then, the proportional structure of the population has remained relatively stable, making it appropriate to use 2021 age shares as a basis for understanding 2025.
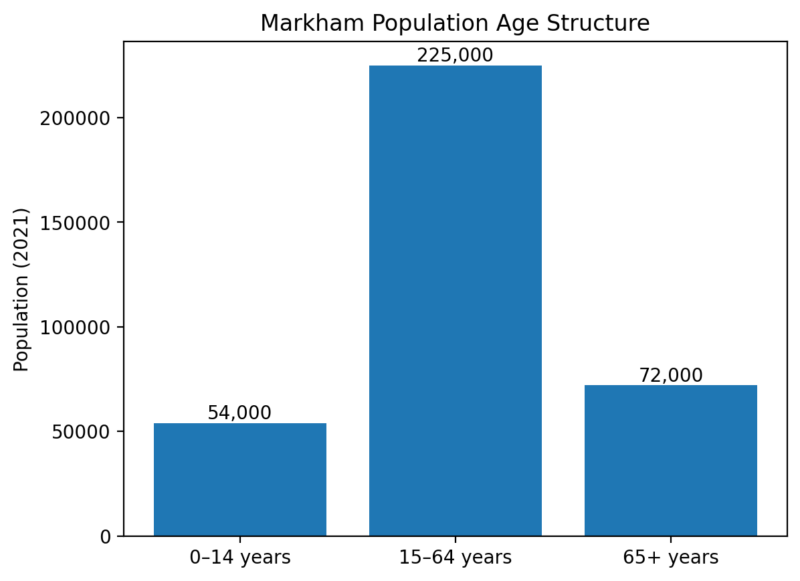
Markham’s population is clearly working-age dominant, with nearly two-thirds of residents between 15 and 64. This reflects the city’s role as both a residential base for GTA employment and a growing employment center in its own right, particularly in technology, professional services, and healthcare.
Children under 15 form a smaller share than in fast-growing outer suburbs, while the senior population is meaningfully larger, a sign of Markham’s gradual aging and long-established homeowner base.
Median Age in 2025 – Stable but Slowly Rising
Markham’s median age in the 2021 Census was approximately 41 years, already higher than many newer suburban municipalities but still lower than many rural or small urban areas in Ontario.
Demographic updates and regional estimates since 2021 consistently place Markham’s median age between 41 and 43 years entering 2025.
| Year | Median age | Interpretation |
| 2016 | ~40.1 | Younger family-oriented growth phase |
| 2021 | ~41.0 | Transition toward maturity |
| 2025 (est.) | ~42 | Gradual aging, not rapid |
The key point is that Markham is aging slowly, not rapidly. Continued immigration, particularly of skilled workers and family units, has offset what would otherwise be a sharper rise in median age as long-time residents grow older.
Working-Age Population and Economic Implications
View this post on Instagram
A working-age share of roughly 64 percent gives Markham a strong demographic base relative to many Canadian cities facing faster aging. This supports:
- Stable labor force participation
- Sustained demand for employment land and office space
- Continued household formation rather than net household contraction
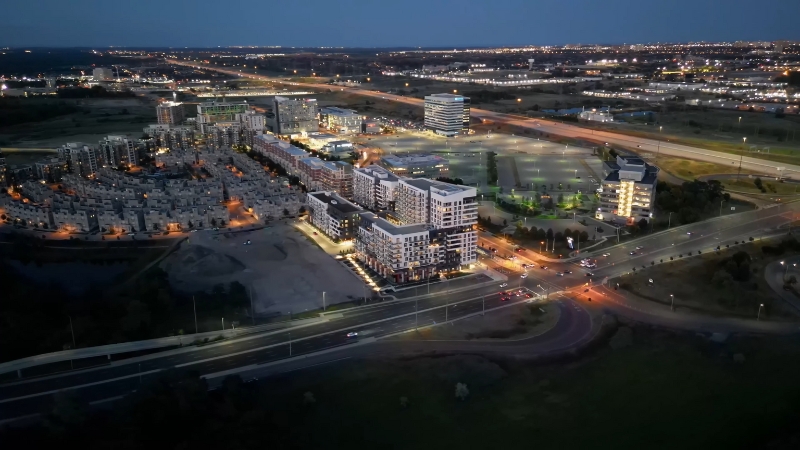
This structure also explains why Markham’s population growth remains steady even as greenfield development slows. Growth is increasingly driven by people per household and redevelopment, not land consumption.
Household Counts and Composition
Household structure is one of the most defining features of Markham’s demographics. According to the 2021 Census, Markham had approximately 110,000 private households, with an average household size significantly above the Ontario average.
| Household indicator (2021) | Value |
| Total private households | ~110,000 |
| Average household size | ~3.0 persons |
| Family households | ~80% of all households |
| One-person households | ~18–20% |
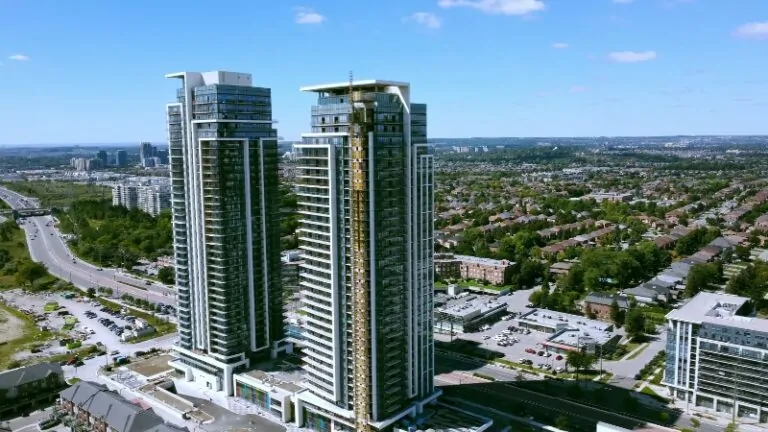
This confirms Markham’s reputation as a family-oriented municipality, even as higher-density housing expands near transit corridors and urban centers such as Markham Centre.
Household Types – What Dominates in Markham
Family households dominate Markham’s housing landscape. Married or common-law couples with children make up a large share, followed by couples without children.
Non-family households and one-person households are growing, but from a smaller base.
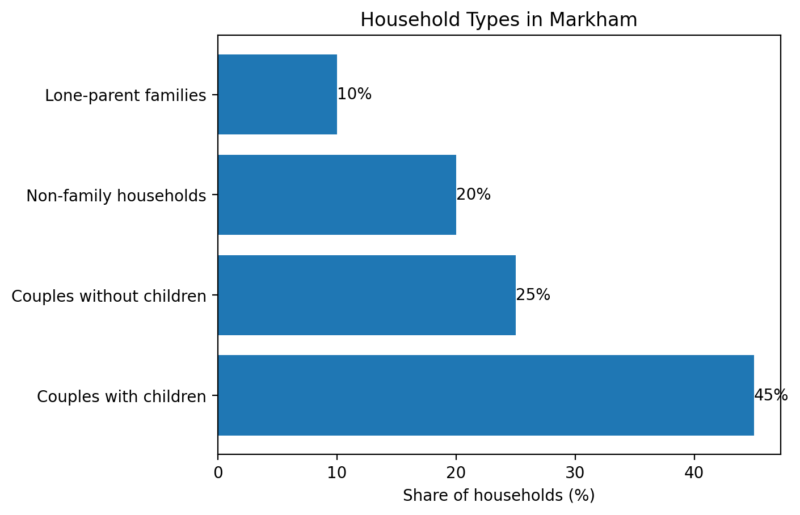
The relatively high share of couples with children explains continued demand for ground-oriented housing, schools, and community infrastructure, even as condominiums increase in absolute number.
How Immigration Shapes Age and Household Structure
Markham’s demographic stability is closely tied to immigration. The city attracts a high proportion of working-age immigrants and family reunification households, which have three measurable effects:
- It keeps the median age from rising too quickly.
- It sustains larger household sizes.
- It supports a broad base of school-age children even as fertility rates decline.
Unlike cities that rely mainly on natural increase, Markham’s age profile is actively replenished by migration, which is why its demographic structure in 2025 closely resembles that of 2021 rather than showing abrupt aging.
Comparison with Nearby GTA Municipalities
Markham’s age and household profile are distinct within the GTA.
| City | Median age (approx.) | Household pattern |
| Toronto | ~40 | Smaller households, more single-person units |
| Markham | ~42 | Larger family households |
| Vaughan | ~39 | Younger, faster growth |
| Richmond Hill | ~43 | Similar maturity, slightly older |
Markham sits between Toronto’s urban profile and the younger outer suburbs, combining economic maturity with demographic stability.
What 2025 Does and Does Not Change
There is no evidence of a structural demographic break in Markham between 2021 and 2025. The city is not undergoing rapid aging, nor is it experiencing explosive youth-driven growth. Instead, it continues along a measured, predictable path.
Population growth continues, but household formation is increasingly shaped by redevelopment, condominium construction, and multigenerational living rather than new subdivisions.
Bottom Line
Markham in 2025 is a city of roughly 360,000 to 365,000 people, anchored by a large working-age population, a median age around 42, and households that remain predominantly family-based.
The demographic structure is stable, mature, and well-balanced. Children and seniors both represent significant shares, but neither dominates the profile. Household sizes remain larger than the provincial average, reflecting long-standing settlement patterns and sustained immigration.