

The estimated population of Toronto in 2025 is 2,832,718. This marks an increase from the 2021 Canadian Census figure of 2,794,356 and the 2016 Census figure of 2,731,571 according to the World Population Review.
As of 2025, estimates suggest the metropolitan area’s population is about 6,431,000, reflecting a 0.93% increase from the previous year as noted by Macrotrends.
Over the past three years, the city has grown by 62,785 people, reflecting an annual growth rate of 0.46%.
Toronto is Canada’s most populous city and serves as the provincial capital of Ontario.
Located on the shores of Lake Ontario, it is the largest city in the Great Lakes region and ranks as the 4th most populous city in North America.
Toronto’s geographical position places it near several major U.S. states.
It is close to New York, with a drive of just 2–4 hours to cities like Buffalo or Niagara Falls, or approximately 1.5 hours by air.
The state of Michigan is also nearby, with a 4-hour drive to Detroit. Additionally, Ohio is reachable within 5–6 hours by car, connecting Toronto to cities such as Cleveland.
Several U.S. cities are in close proximity to Toronto, making it a key hub for cross-border connections. Buffalo, New York, is only 100 miles away, about a 1.5- to 2-hour drive.
Detroit, Michigan, is approximately 230 miles from Toronto, or about 4 hours by car.
Key Takeaways
Demographic Distribution
Toronto’s Population by Age Group

The largest age group in Toronto is the 25-44 age range, comprising nearly one-third of the city’s population at 31.9% according to the Statistique Canada.
This highlights Toronto as a city with a significant working-age demographic. Older adults aged 65 and above account for 17.1% of the population, underscoring the city’s aging trend.
Children under 14 represent a smaller proportion (13.8%), reflecting a decline in younger populations over time.
Share of Population Age 65+ Over Time

The share of the population aged 65 and older has grown steadily over the last decade, from 15.6% in both 2011 and 2016 to 17.1% in 2021.
This increase reflects the aging of the Baby Boomer generation and indicates a growing demand for services and infrastructure catering to older adults.
Decline in Population by Age Groups
Age Group
Percentage Change
0-4
-9.2%
5-9
-4.4%
15-19
-7.4%
20-24
-4.7%
45-49
-7.9%
50-54
-9.1%
The most significant population declines occurred among the youngest (ages 0-4, -9.2%) and middle-aged adults (ages 45-54, -9.1%) as noted in the Toronto City Report.
The decline in young children suggests lower birth rates, while the decline in the middle-aged population corresponds to the aging of the Baby Boomer generation into older age brackets.
Growth in Older Age Groups

Older age groups experienced the most significant growth between 2016 and 2021.
The 70-74 age group grew by 27.0%, largely due to the Baby Boomer generation entering this bracket.
The 95-99 age group saw the fastest growth at 34.7%, reflecting improvements in longevity and healthcare.
The 100+ age group also grew significantly, underscoring an increasing number of centenarians.
Gender Distribution

Women+ slightly outnumber Men+, making up 52% of Toronto’s population. This disparity is consistent with global trends, where females tend to live longer than males.
The balance of gender is most apparent in younger age groups, with greater differences emerging in older age groups.
Male-to-Female Ratios by Age Group
Age Group
Males per 100 Females
0-19
>100
20-24
>100
100+
29
Males outnumber females in younger age groups (up to 20-24), likely due to slightly higher male birth rates and survival rates during early life.
However, the male-to-female ratio declines sharply with age. Among those aged 100+, there are only 29 males for every 100 females, reflecting the longer life expectancy of women.
Panethnic Groups in Toronto

Toronto’s largest demographic group is of European origin, making up 42.30% of the population. This is followed by South Asians at 19.25%, reflecting a significant and growing presence in the city as noted by uscanadainfo.com.
East Asians (12.60%) and Black communities (7.95%) further contribute to Toronto’s rich multicultural landscape.
Smaller but significant groups include Southeast Asians (6.24%), Middle Eastern populations (4.72%), and Latin Americans (2.55%).
Indigenous groups, though a small proportion (0.73%), remain an integral part of Toronto’s cultural identity.
Top 25 Ethnic Origins in Toronto CMA
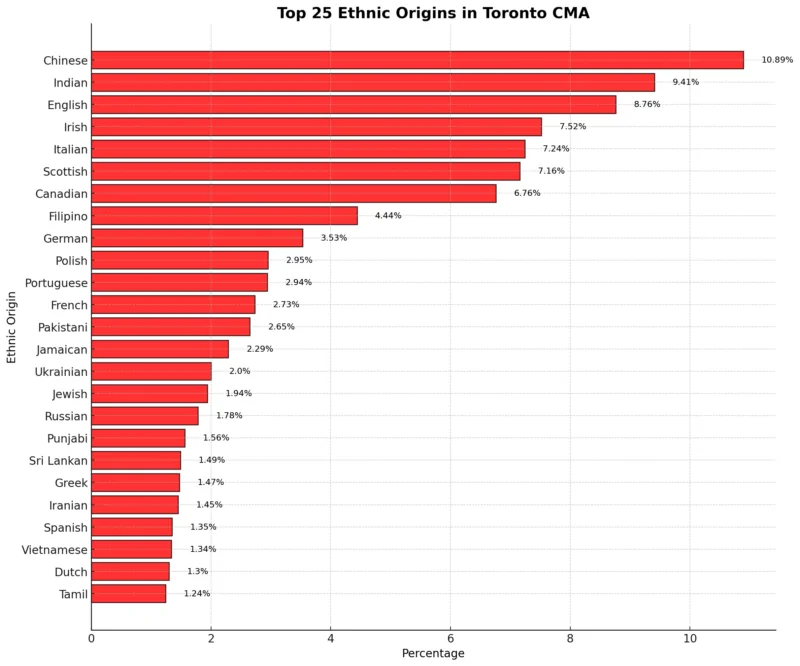
The largest ethnic origins in Toronto include Chinese (10.89%) and Indian (9.41%), showcasing significant East and South Asian communities.
European roots are strongly represented by English (8.76%), Irish (7.52%), Italian (7.24%), and Scottish (7.16%) populations.
Other notable groups include the Filipino community (4.44%) and smaller but culturally impactful groups like Portuguese, Pakistani, and Jamaican.
Together, these diverse ethnicities shape Toronto’s identity as one of the most multicultural cities in the world.
Housing Market
Metric
Ontario
Toronto (GTA)
Average Home Price
$878,620
$1,135,215
1-Year Price Change
+2.6%
+0.8%
Median Sale Price
$337,750 (Zillow Data)
N/A
Median List Price
$420,633 (Zillow Data)
N/A
Sales (October 2024)
N/A
6,658 (up 43% YoY)
Active Listings
N/A
24,481 (up 25% YoY)
Median Days to Pending
47 days
N/A
Percent of Sales Over List
15.5%
N/A
Percent of Sales Under List
51.5%
N/A
As of October 2024, Ontario’s housing market has shown notable activity. The average home price in the province stands at $878,620, reflecting a 2.6% year-over-year increase according to Wowa.
This positions Ontario as one of Canada’s most expensive provinces for homebuyers.
The average home price in the GTA is $1,135,215, marking a 0.8% increase compared to the same period last year.
This figure surpasses the provincial average, highlighting Toronto’s status as a high-demand urban center.
GTA Home Sales Surge in October 2024 Amid Improved Affordability https://t.co/l1S9ROA2Mn via @YouTube
— ishtiaq ahmed (@ishtiak) November 18, 2024
Sales activity in the GTA has been robust, with 6,658 homes sold in October 2024—a 43% increase from October 2023.
This surge in transactions indicates a strong buyer interest, likely influenced by recent rate cuts.
Inventory levels have also adjusted, with active listings in the GTA at 24,481, up 25% year-over-year.
This increase provides buyers with more options, contributing to a balanced market.
Ontario and Toronto Job Market Overview: October 2024
Ontario Job Market Highlights
Metric
Value
Change
Working Population
8,101,100
-0.1% since September
Unemployment Rate
6.8%
-0.1 points since September
Full-time Job Losses
-11,200
-0.2%
Goods-Producing Sector Jobs
+5,000
+0.3%
Services-Producing Sector Jobs
-15,900
-0.2%
Ontario’s employment declined slightly in October 2024, primarily due to losses in the services-producing sector (-0.2%).
The unemployment rate dropped marginally to 6.8%, while the goods-producing sector showed resilience with a 0.3% increase in jobs (+5,000) according to the jobbank.com.
Toronto Job Market Highlights
Metric
Value
Change
Employment
3,925,100
+2.3% since October 2023
Unemployment Rate
8.2%
+1.2 points since October 2023
Population Growth
+4.9%
+300,300
Labour Force Growth
+3.7%
N/A
Toronto’s employment increased by 2.3% year-over-year, adding 87,900 jobs, with significant population and labor force growth.
However, the unemployment rate rose to 8.2%, reflecting increased competition in the labor market.
Investments like the York Battery Energy Storage System and Kepler Communications Inc. underscore ongoing economic activity in the region.
Industry-Specific Changes in Ontario

- Business and Support Services: This sector saw the highest growth (+6.6%), adding 18,700 jobs due to easing inflation and increased business investments.
- Finance and Real Estate: Declined by -1.7%, losing 12,700 jobs. Despite losses, momentum in the housing market from interest rate cuts may stabilize future growth.
- Forestry and Mining: Added 1,900 jobs (+5.0%), supported by federal investments in critical mineral projects in Northern Ontario.
Unemployment Rates by Region in Ontario

- Lowest Unemployment: Muskoka–Kawarthas (2.6%), reflecting strong local economic conditions.
- Highest Unemployment: Toronto (8.2%), driven by labor force growth outpacing job creation.
- Windsor-Sarnia: Also high at 8.0%, potentially influenced by manufacturing sector challenges.
Toronto and Ontario Minimum Wages
Minimum Wage Increase Details
Metric
Previous Rate
New Rate
Change
General Minimum Wage
$16.55/hour
$17.20/hour
+3.9%
Effective Date
N/A
April, 2025
N/A
The increase from $16.55 to $17.20 per hour represents a 3.9% annualized raise, aligned with the Ontario Consumer Price Index (CPI).
This adjustment makes Ontario’s minimum wage the second highest in Canada, benefiting nearly one million workers.
Impact on Workers

A worker earning the general minimum wage and working full-time (40 hours per week) will see an annual pay increase of $1,355.
This provides financial relief to individuals and families facing rising living costs while helping stabilize disposable income.
Workers Benefited
Group
Number of Workers
Percentage of Ontario Workforce
Earning ≤ $17.20/hour
935,600
~11.5% (estimated)
Approximately 935,600 workers earned at or below $17.20/hour in 2023 according to the News Ontario.
This increase will directly benefit these workers, improving wage equity and supporting household incomes in lower-earning demographics.
Tax Brackets
In Canada, both federal and provincial governments levy personal income taxes, with rates varying based on income levels according to turbotax.
You can check here more of the federal and Ontario provincial tax brackets and rates for the 2025 tax year.

Ontario Provincial Tax Brackets and Rates

Combined Federal and Ontario Tax Rates
When calculating your total income tax payable, it’s essential to consider both federal and provincial rates. The combined marginal tax rates for Ontario residents in 2024 are as follows:

Immigration
Migration Type
Net Change
Comparison to Q2 2023
Net Population Increase
+85,067
-39.4%
Net Interprovincial Migration
-9,211
-9.3%
Net International Immigration
+94,278
-37.4%
Ontario’s population saw a net increase of 85,067 in Q2 2024, primarily driven by international immigration, which added 94,278 people.
However, this represents a significant decline (37.4%) from the same quarter in 2023.
Losses from interprovincial migration offset some of this growth, with a net outflow of 9,211 residents, though the interprovincial losses also declined compared to the previous year.
Interprovincial Migration
Metric
Value (Q2 2024)
Comparison to Q2 2023
Inflow from Other Provinces
25,480
-5.8%
Outflow to Other Provinces
34,691
-6.8%
Net Interprovincial Loss
-9,211
-9.3%
Ontario continues to experience a net loss in interprovincial migration, with 34,691 people leaving for other provinces and 25,480 arriving.
While this results in a net outflow of 9,211 people, the overall interprovincial migration losses have decreased by 9.3% compared to Q2 2023.
International Immigration
Metric
Value (Q2 2024)
Comparison to Q2 2023
Net International Immigration
+94,278
-37.4%
International immigration remains a critical driver of population growth in Ontario, with 94,278 new residents arriving from abroad in Q2 2024.
Despite this, the number of international immigrants decreased significantly (37.4%) compared to Q2 2023, likely reflecting global and domestic policy shifts or economic factors impacting immigration levels.
Application Processing Times for Immigrants
View this post on Instagram
IRCC processing times vary by application type and applicant location.
Applicants can check current processing times specific to their application category and country of residence.
Applicants can monitor their application status through the IRCC Client Application Status tool or by linking their application to an online account for real-time updates.
Labour Market Impact Assessment (LMIA) Processing Times
LMIA Stream
Average Processing Time
Notes
Global Talent Stream
7 business days
Fastest processing time
High-Wage Stream
2-3 months
Low-Wage Stream
2-3 months
Agricultural Stream
1-3 weeks
Seasonal Agricultural Worker Program
1-2 weeks
Permanent Residence Stream
3-4 months
LMIA processing times differ across streams, with the Global Talent Stream being the quickest at approximately 7 business days.
Other streams, such as High-Wage and Low-Wage, have longer processing times ranging from 2 to 3 months.
Methodology
- We compiled data from reputable sources like Statistics Canada, IRCC, and provincial government reports.
- Information was verified and cross-referenced to ensure accuracy and relevance for 2024.
- Insights on demographics, housing, labor, and immigration trends were analyzed using current datasets.
- Tax brackets and minimum wage details were extracted from government releases and economic portals.
- Key data points were summarized into tables and visuals to enhance readability.
- The final article was structured to provide comprehensive yet concise insights tailored for easy understanding.
References
- World Population Review – Toronto Population
- Macrotrends – Toronto Population
- Statistics Canada – 2021 Census: Age, sex at birth, and gender
- Toronto City Report – Age, Sex, and Gender Backgrounder
- U.S. Canada Info – Toronto Population
- Wowa – Ontario Housing Market
- Wowa – Toronto Housing Market
- Job Bank Canada – Job Market Snapshot
- Ontario Newsroom – Ontario Raising Minimum Wage
- TurboTax – Ontario Income Tax Calculator