
The estimated population of Edmonton in 2025 is approximately 1,060,667, based on a 1.61% annual growth rate since the 2021 Canadian Census, which recorded a population of 1,010,899.
The urban agglomeration population is estimated at around 1,567,620, according to the UN World Urbanization Prospects.
Additionally, the Edmonton Census Metropolitan Area (CMA) is estimated to have a population of about 1,568,000, reflecting a 1.55% increase from 2023 as noted by Macrotrends.
These variations arise due to differing definitions of Edmonton’s boundaries and the methodologies used in population calculations.
City Size, Demographics, and Growth
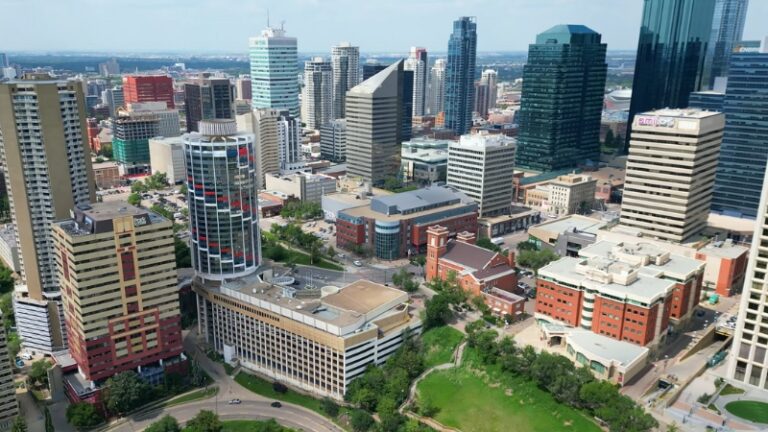
Edmonton, the capital of Alberta, is a dynamic city with a rich history and a rapidly growing population. Located in the Edmonton Capital Region along the North Saskatchewan River, it is the northernmost city in North America with a metro population of over one million.
The city proper spans approximately 685.25 square kilometers with a population density of 1,186 people per square kilometer (3,074/sq mi).
The Edmonton metropolitan area, by contrast, has a much lower density of 123 people per square kilometer (319/sq mi) according to the World Population Review.
Metric
City Proper
Metro Area
Total Area
685.25 sq km
–
Population Density
1,186 people/sq km
123 people/sq km
Ethnic Composition

Religious Affiliation

Historical Development
Edmonton’s history dates back to Indigenous settlements as early as 12,000 BC. European contact began in 1754 with Anthony Henday’s exploration of the Hudson’s Bay Company (HBC).
The establishment of Fort Edmonton in 1795 marked the city’s importance in the fur trade.
The city’s expansion took off with the Canadian Pacific Railway (1885) and Calgary & Edmonton Railway (1891). Edmonton was incorporated as a town in 1892 with 700 residents and became a city in 1904, growing to a population of 8,350.

Population Growth and Expansion
Edmonton has consistently grown faster than the national average. Between 2006 and 2011, the city’s population increased by 12%, compared to Canada’s 5.9% growth rate.
The city is planning to annex 156 square kilometers to support its projected population growth, which could add another 650,000 residents by 2044.
Growth Metrics
Value
Population Growth (2006-2011)
12%
National Growth Rate (2006-2011)
5.9%
Planned Annexation Area
156 sq km
Anticipated Population by 2044
1.7 million
Age Distribution

Edmonton’s population is youthful, with 18.2% under the age of 14, the largest age group. Young adults aged 25 to 34 follow at 16.4%.
Meanwhile, the senior population (over 65) comprises 13.7%, reflecting an aging segment that is smaller than the younger cohorts but still significant.
Population by Gender
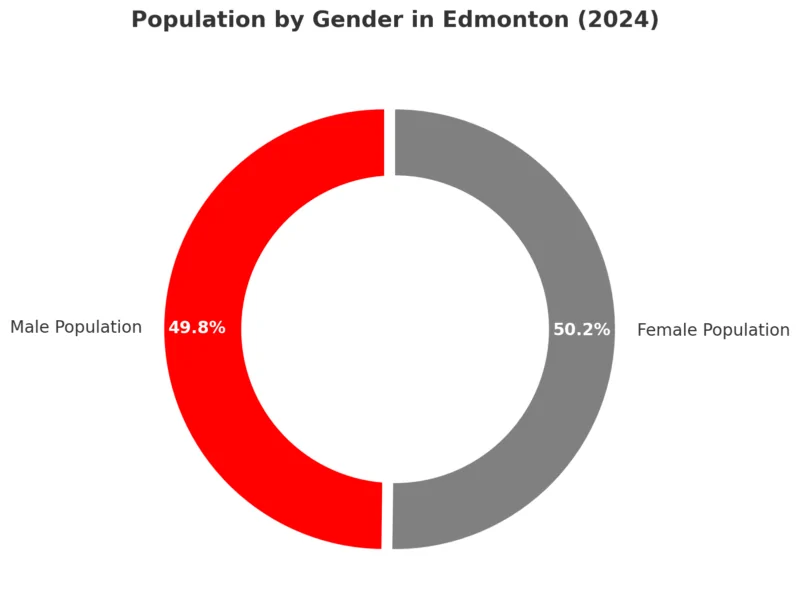
The population in Edmonton is nearly evenly divided between genders, with females accounting for a marginally higher percentage (50.2%) compared to males (49.8%) according to Point2Homes.
Edmonton Market Report
Metric
Value
Monthly Change
Year-over-Year Change
Average Selling Price
$396,800
-0.7%
+7.8%
The average home price in Edmonton has risen by 7.8% year-over-year, reaching $396,800 in October 2024 as it is noted by nesto.ca.
However, compared to the previous month, prices have slightly declined by 0.7%, suggesting a potential stabilization or seasonal adjustment in the market.
Single-Family Home Prices
Metric
Value
Monthly Change
Year-over-Year Change
Average Selling Price
$459,900
-0.5%
+9.3%
Single-family home prices in Edmonton experienced a strong annual growth of 9.3%, climbing to $459,900.
Month-over-month, there was a modest decrease of 0.5%, potentially reflecting typical market fluctuations.
Townhouse and Multiplex Prices
Metric
Value
Monthly Change
Year-over-Year Change
Average Selling Price
$268,600
+0.2%
+13.6%
Townhouse and multiplex prices showed the highest annual increase, rising by 13.6% year-over-year to $268,600.
A slight monthly increase of 0.2% suggests continued demand for this housing type.
Condominium Prices
Metric
Value
Year-over-Year Change
Average Selling Price
$196,000
+10.5%
Condo prices in Edmonton increased by 10.5% year-over-year, reaching $196,000.
This growth demonstrates a rebound in the condominium market, which has historically been more volatile.
Rental Market
Metric
Value
Year-over-Year Change
Average Monthly Rent
$1,584
+8.0%
The rental market in Edmonton saw an 8.0% year-over-year increase in average rents, with the average rent for October 2024 at $1,584.
This growth reflects continued demand in the rental sector, likely driven by population growth and affordability challenges in homeownership.
Unemployment Rate

In October 2024, Canada’s unemployment rate increased to 6.5%, up 0.8 percentage points from the previous year.
Alberta’s unemployment rate was significantly higher at 7.3%, marking an increase of 1.4 percentage points compared to October 2023 as per Economic Dashboard.
This indicates Alberta experienced a sharper rise in unemployment than the national average, potentially due to regional economic factors such as fluctuations in the energy sector.
Monthly and Year-to-Date Trends for Alberta

Alberta’s unemployment rate not only rose on a year-over-year basis but also saw its year-to-date average increase by 1.2 percentage points.
This suggests a sustained trend of higher unemployment throughout 2024, signaling economic challenges in the province.
Provincial Unemployment Comparison

Among the provinces, Alberta’s unemployment rate of 7.3% ranks third highest, following Newfoundland and Labrador (10.0%) and Prince Edward Island (9.8%).
This positions Alberta above the national average of 6.5%, underscoring regional disparities in employment conditions.
Industry Unemployment Rates
Industry
Unemployment Rate (%)
Information, Culture, and Recreation
17.4%
Utilities
~9%
Other Services (except Public Admin)
~8%
Accommodation and Food Services
~8%
Retail Trade
~7%
Business, Building, and Other Support Services
~7%
Public Administration
~6%
Construction
~5%
Wholesale Trade
~5%
Transportation and Warehousing
~4%
Finance and Insurance
~4%
Manufacturing
~3%
Healthcare and Social Assistance
~3%
Educational Services
~2.5%
Mining, Quarrying, and Oil/Gas
~2%
Professional, Scientific, and Technical Services
~2%
Agriculture
~1.5%
Forestry, Fishing, and Hunting
~1%
Real Estate and Rental Leasing
~1%
The industry with the highest unemployment rate was Information, Culture, and Recreation, standing at 17.4%, significantly higher than other industries. This sector might face challenges related to funding, demand shifts, or labor structure issues.
Sectors like Utilities, Other Services, and Accommodation and Food Services reported higher unemployment rates (8–9%), indicating potential workforce adjustments or economic challenges in these areas.
Industries such as Mining, Quarrying, Oil/Gas, Professional Services, Agriculture, and Real Estate had the lowest unemployment rates (1–2%), showcasing stability and resilience, likely tied to consistent demand or specialized skill requirements.
Healthcare and Social Assistance and Educational Services also showed low unemployment rates (~2–3%), reflecting the ongoing demand for professionals in these essential sectors.
Edmonton Alberta Average Salary Overview
The average salary for individuals in Edmonton, Alberta, is $65,026 per year or approximately $33.35 per hour, based on data from 2,201 recorded salaries as per CA Talent.
Salary variations depend on experience level, with entry-level positions earning lower wages and experienced workers earning significantly higher salaries.
Salary Breakdown

Edmonton Salaries by Region Comparison

The salary range in Edmonton spans from $44,051 for entry-level positions to $124,800 for experienced roles, reflecting significant opportunities for earnings growth with experience and skill development.
Edmonton’s average salary of $65,026 is significantly higher than the Alberta provincial average of $39,000, highlighting its position as a higher-paying region within the province.
While Edmonton’s average salary is strong, it falls short of Ontario’s average of $90,000, which could be influenced by differences in cost of living, industry distribution, and job opportunities.
The post-tax income for an individual earning $65,026 would depend on tax rates in Alberta, but it is estimated to be $51,000–$53,000 annually, depending on deductions and tax credits.
Minimum Wage in Alberta and Edmonton 2025
Minimum Wage Category
Rate
Effective Date
Next Scheduled Increase
General Minimum Wage
$15.00 per hour
Since Oct 1, 2018
Not Announced
Student Minimum Wage (Under 18)
$13.00 per hour (up to 28 hours/week)
Since Jun 26, 2019
Not Announced
Weekly Minimum Wage
$598 per week (Certain professions)
–
Not Announced
Domestic Employees (Live-in)
$2,848 per month
–
Not Announced
Domestic Employees (Live-out)
$15.00 per hour
–
Not Announced
The general rate in Alberta has been fixed at $15.00 per hour since October 1, 2018, making it one of the higher rates in Canada. However, it has not kept pace with rising living costs, leading to concerns about affordability for workers.
Youth under 18 working part-time (up to 28 hours per week) earn $13.00 per hour, which has been in effect since June 26, 2019. This lower rate reflects Alberta’s policy on youth employment but has also been criticized for being insufficient.
Certain professions are paid $598 per week, offering a fixed weekly income.
Live-in employees receive a monthly minimum of $2,848, while live-out employees are paid $15.00 per hour.
Student Population Growth in Edmonton’s Division Schools (2011–2023)
Between September 2011 and September 2023, the student population in Edmonton’s Division schools increased by 43%, reaching 115,176 students in 2023 as noted by ESPB.
This growth has outpaced Alberta’s average population growth, emphasizing the dynamic expansion of the city’s youth demographic.
Alberta is also one of the best provinces in Canada for international students looking for PR.

The Division experienced a 43% increase in student numbers over 12 years, demonstrating robust demand for education in Edmonton. This growth reflects a substantial influx of school-aged children and highlights the city’s thriving youth demographic.
The EAL student population saw the highest growth, increasing by 105.3%. This dramatic rise underscores Edmonton’s growing multicultural and immigrant communities, which have significantly diversified the Division’s student body.
School space can’t keep up with growing Edmonton public student growthhttps://t.co/36D2aQZw7T
— Usa Jaun News🇺🇸 (@UsaJaunNews) November 29, 2024
Self-identified First Nations, Métis, and Inuit student enrolment increased by 31.5%, reflecting successful efforts to engage Indigenous populations and promote inclusion within the education system.
Students with provincial special education coding increased by 34.4%, showcasing the Division’s dedication to providing tailored educational support for diverse learning needs as the population expands.
Edmonton Crime Rate
View this post on Instagram
The Edmonton Police Service (EPS) reported a 7.2% drop in the overall crime rate in 2023 compared to 2022, primarily due to a decrease in non-violent crimes, such as property offenses. This improvement highlights the effectiveness of focused policing strategies and community safety programs.
However, violent crimes rose by 4.6% during the same period, signaling ongoing challenges and the need for enhanced safety measures. Initiatives such as the Guns and Gangs Strategy and Safer Public Spaces programs remain critical to addressing this issue.
Key Crime Statistics

Violent Crime Trends
While overall crime decreased, the severity of violent crimes in Edmonton increased by 7.3%. Key contributors to this trend included:
- Assaults: A significant portion of violent crime, showing an uptick in 2023.
- Robberies: Experienced a noticeable rise.
- Sexual Offenses: Increased, raising concerns about safety and the need for preventative measures.
These trends reflect a broader national challenge, as cities like Vancouver have also reported similar increases in violent crime rates.
Comparative Crime Statistics (2022 vs. 2023)

While the overall crime rate decreased in 2023, the severity of violent crime saw a sharper rise compared to 2022.
Methodology
We compiled information from reliable sources, including Canadian Census data, Government of Alberta statistics, and reputable market and demographic reports such as World Population Review, nesto.ca, and Economic Dashboard.
Growth rates, population trends, and demographic changes were analyzed to provide insights into Edmonton’s population, housing, and labor market.
We compared Edmonton’s statistics with provincial and national averages to highlight its unique trends and disparities.
Key metrics were organized into clear categories, such as population growth, student demographics, housing market trends, and industry-specific unemployment rates.
Tables and structured sections were used to present numerical data and key findings concisely for better readability and interpretation.
Historical and economic context was integrated to provide a holistic understanding of Edmonton’s growth and development over time.
References
- Statistics Canada: 2021 Canadian Census
- UN Population Division: UN World Urbanization Prospects
- Macrotrends: Edmonton Population Trends
- World Population Review: Edmonton Population
- Nesto.ca: Edmonton Housing Market Outlook 2024
- Point2Homes: Edmonton Demographics
- Alberta Economic Dashboard: Unemployment Rate
- CA Talent: Edmonton Salary Insights
- Edmonton Public School Board (EPSB): Annual Education Results Report