
The city’s population is estimated at 1,798,853, marking it as the second largest city in Canada according to the World Population Review.
This growth reflects its enduring appeal as both a cultural hub and an economic powerhouse.
The diversity of Montreal’s populace plays a significant role in shaping the city’s identity. With its unique mix of cultures and languages, Montreal stands out as a bilingual city.
Key Takeaways
Total Population
As of 2025, Montreal’s population is estimated to be approximately 4,342,000 in the metro area, reflecting its continued growth according to the Macrotrends.
The city has a population density of 4,517 people per square kilometer (equivalent to 11,701 residents per square mile) within its city limits. In contrast, the metro area has a lower density, with 898 people per square kilometer (2,326 residents per square mile).
The city’s total land area measures 431.50 square kilometers (166.60 square miles)
Age Structure

The average age of the population is 40.6 years, with a median age of 38.8 years, indicating a moderately young demographic.
The 20 to 29 age groups are the largest, with 153,995 people aged 25 to 29 and 125,235 aged 20 to 24, reflecting a significant representation of young adults, likely contributing to workforce and educational demographics.
The population steadily decreases after age 30, with notable declines in the older age groups. Individuals aged 70 and above account for a smaller portion, with 72,300 aged 70 to 74, and numbers tapering significantly in groups such as 85 to 89 (27,835) and 90 to 94 (14,360).
The population aged 95 and older is the smallest, at just 3,375 people.
Gender Balance
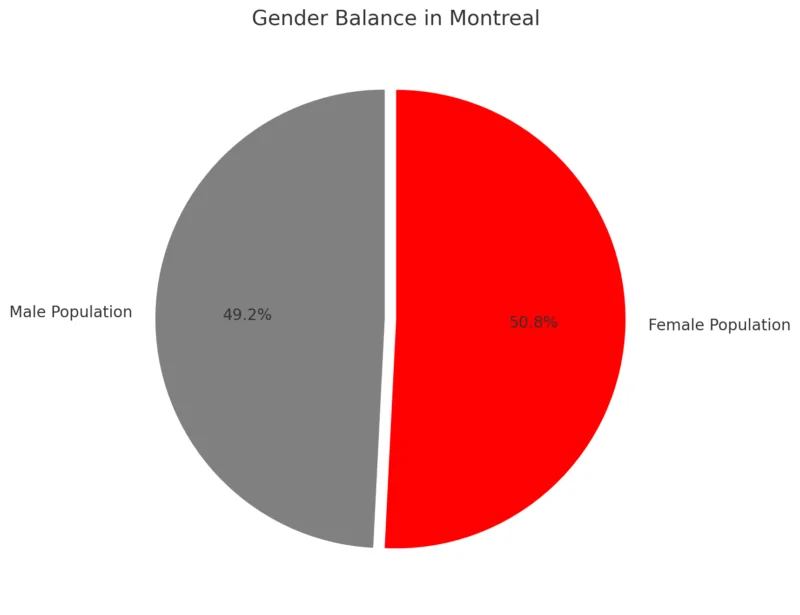
The population is relatively balanced by gender, with 50.8% female and 49.2% male, showing a slight majority of females.
This distribution aligns with typical demographic patterns observed in many regions, where females slightly outnumber males according to Point2Homes.
The near-equal ratio suggests gender equity in demographic representation, which can influence social and economic planning, including healthcare, education, and workforce policies.
Language Distribution in Montreal (2024)

Montreal showcases strong bilingualism, with 58.47% of the population speaking both English and French, reflecting its unique cultural and linguistic identity. French-only speakers account for 27.19%, emphasizing the city’s Francophone roots.
English-only speakers represent 11.93%, while 2.41% of residents speak languages other than English or French, highlighting the city’s growing multicultural fabric. These figures reinforce Montreal’s reputation as a vibrant, multilingual metropolis.
Migration Patterns
Period
CMA
Interprovincial
Interprovincial
International
Total
2011–16
Toronto
-7,326
-120,891
381,494
253,277
Montreal
-43,846
-40,311
208,247
124,090
Vancouver
11,905
-26,506
124,162
109,561
2016–21
Toronto
6,460
-272,614
458,402
192,248
Montreal
-25,596
-100,661
174,492
48,235
Vancouver
26,916
-63,598
148,330
111,648
2021–22
Toronto
-21,388
-78,077
159,489
60,024
Montreal
-5,408
-29,480
48,668
13,780
Vancouver
4,171
-14,327
63,322
53,166
All three CMAs experienced substantial intraprovincial losses, growing notably between 2011–16 and 2016–21. Toronto saw the largest losses, with -272,614 during 2016–21.
Vancouver consistently recorded gains in interprovincial migration, peaking at 26,916 in 2016–21. Montreal, by contrast, consistently ran deficits, with -43,846 in 2011–16 and -25,596 in 2016–21.
International immigration offset internal losses across all three cities, though the magnitude varied. Toronto saw the highest gains in 2016–21 (458,402), while Montreal lagged behind Vancouver in 2021–22 (48,668 vs. 63,322).
Despite international gains, total migration balances were negative or small in 2021–22 for all cities, reflecting significant internal migration losses.
Interprovincial Out-Migration by Community Type (2016–21)

Across all three cities, mid-sized cities were the most popular destination for intraprovincial out-migrants. Toronto led with 204,514 out-migrants heading to mid-sized cities, compared to Montreal’s 60,061 and Vancouver’s 37,798.
Out-migration to rural areas was significantly lower, with Toronto recording 22,500, Montreal 16,200, and Vancouver 11,000.
Small cities attracted moderate out-migration numbers, peaking at 45,600 from Toronto, followed by Montreal (24,400) and Vancouver (14,800).
Toronto experienced the highest overall interprovincial out-migration (272,614), while Vancouver saw the lowest (63,598).
Labor Market Effect
Statistics
June 2024
July 2024
August 2024
September 2024
October 2024
Population (x 1,000)
3,865.9
3,881.3
3,893.1
3,906.3
3,916.3
Labour force (x 1,000)
2,551.6
2,556.8
2,591.1
2,583.0
2,605.0
Employment (x 1,000)
2,380.3
2,386.2
2,408.5
2,423.5
2,424.6
Unemployment (x 1,000)
171.3
170.6
182.7
159.5
180.4
Unemployment rate (%)
6.7
6.7
7.1
6.2
6.9
Participation rate (%)
66.0
65.9
66.6
66.1
66.5
Employment rate (%)
61.6
61.5
61.9
62.0
61.9
STEM Jobs (Estimate)
–
–
–
320.0
340.0
Permanent Residency Obligations Met (%)
87.0
87.5
88.2
88.8
89.5
Tax Bracket (Median Income, $)
20.5%
20.5%
20.5%
20.5%
20.5%
The labor force steadily increased from 2,551.6k in June to 2,605.0k in October, reflecting growth in workforce participation.
Employment also showed consistent improvement, peaking at 2,424.6k in October, despite slight fluctuations in unemployment rates, which peaked at 7.1% in August before decreasing.
STEM job estimates reveal a marked increase, with figures rising from approximately 320k in September to 340k in October. This aligns with targeted efforts to attract skilled workers in science, technology, engineering, and mathematics fields.
View this post on Instagram
Compliance with permanent residency obligations improved steadily, reaching 89.5% in October, driven by enhanced residency tracking systems and supportive immigration policies.
The median income level places the majority of workers in the 20.5% tax bracket, consistent across the observed period. This reflects stable earnings in Montreal’s workforce.
Housing Market Trends
Metric
All Properties
Single-Family Detached
Condo Apartment
Plexes
Average Sold Price
$630,063
N/A
N/A
N/A
Median Sold Price
$589,000
$589,000
$414,250
$789,500
1-Month Change (%)
-0.3%
-0.2%
-0.2%
-0.3%
12-Month Change (%)
+8.9%
+8.1%
+6.2%
+7.4%
Transactions (Buy/Sell)
3,824
1,925
1,493
404
1-Month Change in Sales (%)
+19.5%
+18%
+20.2%
+24.3%
12-Month Change in Sales (%)
+43%
+43%
+47%
+32%
Wowa notes that the Montreal housing market in October 2024 experienced significant growth, with an 8.9% annual increase in average home sold price, reaching $630,063. Median prices rose across property types, with single-family homes at $589k, condos at $414k, and plexes at $790k.
Montreal’s Housing Market Hits a 20-Year Record 📈:
• Sales up 44% YoY, the strongest October in decades. 🏡
• Rate cuts allow for 12.5% more buyers to qualify for mortgages. 💸
• Single-family home prices in Montreal CMA hit $589K, up 8% YoY. 📊
Thoughts?💭
— Joey Blu (@TheJoeBlu) November 19, 2024
Transactions surged, showing a 43% year-over-year increase for all properties, with plexes experiencing a more moderate 32% rise.
Month-over-month declines in prices (-0.2% to -0.3%) indicate slight cooling, potentially driven by higher mortgage rates, which currently stand at 4.14% for a 5-year fixed rate.
Education
Metric
Value
High School Graduation Rate
84.2% (+0.1%)
Job Openings in the Education Sector
1,094
Classrooms with Optimal Air Quality
92.6%
Montreal’s education system demonstrates steady progress, with an 84.2% high school graduation rate, a slight increase reflecting ongoing improvement in student outcomes.
The 1,094 job openings in education highlight a pressing demand for educational professionals, suggesting opportunities for workforce development in this sector.
Additionally, maintaining 92.6% of classrooms with optimal air quality showcases a strong focus on providing healthy and conducive learning environments, ensuring better educational experiences for students according to CityNews Montreal.
Crime Stats Montreal

Montreal maintains a relatively low crime rate compared to other major Canadian cities, with most incidents being non-violent property crimes such as theft from vehicles (779.5/month) and breaking and entering (717.1/month).
Mischief incidents average 587.4 per month, indicating consistent but manageable levels of vandalism and similar activities according to the News.
Violent crimes like armed robbery (151.1/month) are infrequent, while fatal crimes are rare, averaging just 2.1 per month, reflecting Montreal’s reputation as a safe city.
The seasonal variation in crimes, such as lower rates during winter, further highlights how environmental factors impact criminal activity.
Methodology
This article was crafted using verified data sources including World Population Review, Macrotrends, and government datasets such as Statistics Canada and CityNews Montreal. Population and demographic insights were derived from census records and recent estimates to ensure relevance.
Housing, labor, and crime statistics were analyzed from real estate platforms, police reports, and labor market updates to capture key trends.
We contextualized the data by comparing it to historical benchmarks and national averages. The educational data was sourced from sector-specific reports highlighting progress and challenges. Finally, all information was synthesized into clear takeaways and formatted for easy readability.
References
- World Population Review – Montreal Population
- Macrotrends – Montreal Population Growth
- Point2Homes – Montreal Demographics
- CityNews Montreal – Quebec Unveils a New Education Dashboard
- WOWA – Montreal Housing Market
- CBC News Interactive – Montreal Crime Statistics
- Canada Immigration News – Best Canadian Provinces to Get PR
- Statistics Canada – Labour Force Characteristics in Montreal