

Calgary’s population is estimated to reach 1,349,078 in 2025. According to the 2021 Canadian Census, the city’s population was recorded at 1,306,784
As of 2025, Calgary’s population is estimated at 1,665,023 in its metro area according to World Population Review.
In 1950, Calgary had a population of 132,073.
Calgary’s population is estimated to reach 1,349,078 in 2025.
Over the past year, the city’s population increased by 25,410, reflecting an annual growth rate of 1.55%.
These figures are based on the most recent updates from the UN World Urbanization Prospects.
Key Takeaways
Age Groups
Category
2021 Figure
Change Since 2016
Change Since 2001
Percentage of Population (2021)
Notes
Population aged 65+
177,405
+28%
+119%
14%
Fastest-growing age group; more than doubled since 2001.
Population aged 15–29
240,245
-3%
+21%
18%
Slowest-growing age group; growth rate is less than half of the general population.
Median Age (Overall)
38 years
N/A
N/A
N/A
Lower than most major Canadian cities except Edmonton and Regina.
Lowest Median Age Areas
N/A
N/A
N/A
N/A
Found near Greater Downtown, University of Calgary, and newer communities in various areas.
Highest Median Age Area
60 years
N/A
N/A
N/A
Recorded in a census tract south of the Glenmore Reservoir.
In 2021, 177,405 Calgarians were aged 65 years and over, representing a 28% increase from 138,405 in 2016. Over the past 20 years, this group has been the fastest-growing age demographic in Calgary, more than doubling from 81,150 in 2001. By 2021, individuals aged 65 and over made up 14% of Calgary’s total population according to Calgary.ca.
In contrast, there were 240,245 Calgarians aged 15 to 29 in 2021, a 3% decrease from 248,510 in 2016. Over the past two decades, this age group grew the slowest in Calgary, with a 21% increase since 2001, which is less than half the growth rate of the general population. By 2021, 18% of Calgary’s population fell into this age group.
Compared to other major Canadian cities in 2021, Calgary had a relatively low median age of 38 years. Edmonton and Regina had lower median ages, while cities such as Montreal, Winnipeg, Toronto, Ottawa, Halifax, and Greater Vancouver had higher median ages (98-10-0022-01).
Gender Distribution
Transgender and Non-Binary Population in Calgary (2021)

The transgender and non-binary population in Calgary totaled 4,640 in 2021, with non-binary individuals comprising the largest group (1,870).
The age distribution skews younger, with about two-thirds of this population aged 15 to 34, indicating a younger demographic profile for gender diversity in Calgary according to Point2Homes.
Calgary Population by Gender

Calgary’s gender distribution in 2021 was nearly balanced, with females slightly outnumbering males (50.4% vs. 49.6%). This even split suggests gender parity across the broader population.
Additional Demographics
Metric
Value
Average Age
38.8 years
Age Range of Most Transgender and Non-Binary Individuals
15–34 years
The average age in Calgary was 38.8 years in 2021, slightly younger than the national median age. The transgender and non-binary population is predominantly younger, concentrated within the 15–34 age range, highlighting an age-based concentration of gender diversity in Calgary’s population.
Racial and Ethnic Composition of Calgary (2011)

Calgary in 2011 was predominantly White (67.3%), with visible minorities making up nearly one-third (30.1%) of the population. Aboriginal peoples accounted for 2.7%.
Breakdown of Visible Minority Groups
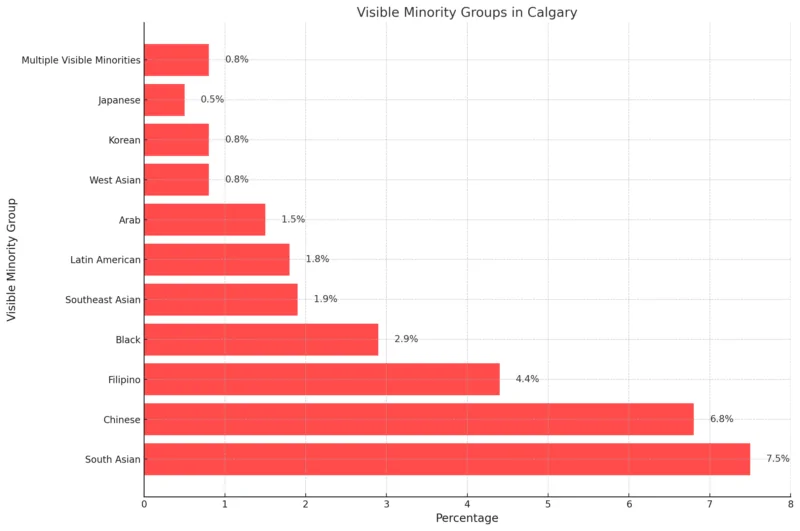
South Asians were the largest visible minority group (7.5%), followed by Chinese (6.8%) and Filipinos (4.4%). Smaller groups included Blacks (2.9%) and Latin Americans (1.8%).
Population Density
The city of Calgary has a population density of 1,329 people per square kilometer (3,442 per square mile) across an area of 825 square kilometers.
Labor Market Contributions
Metric
Value
Unemployment Rate
7.9%
Change from Previous Month
+0.2%
Change from June 2020 Peak
-7.6%
Comparison to Long-Run Average
Above Average
The unemployment rate in Calgary rose slightly by 0.2% in November 2024, reaching 7.9% according to stats.crea. Although this is significantly lower than the peak of 15.5% in June 2020, it remains higher than the long-term average, indicating that economic recovery is ongoing but incomplete.
Calgary’s unemployment rate is trending higher than Canada’s — but it’s not because of layoffs https://t.co/cF0b8SnZsZ
— calgarynews (@calgarynews) December 9, 2024
Job Changes in Calgary
Job Type
Change (Month-over-Month)
Total Jobs (Impact)
Full-Time Jobs
+2,800
Record High
Part-Time Jobs
-7,700
Decline
Total Jobs
-4,900
Net Decrease
While full-time employment increased by 2,800 jobs in November 2024, reaching a record high, the loss of 7,700 part-time positions led to an overall decline of 4,900 jobs.
This indicates a shift in employment patterns, with more emphasis on full-time roles, potentially reflecting changes in labor market demand.
Housing Market

Calgary’s housing market remains strong, with average and median home prices showing significant annual growth (14% and 15%, respectively), despite slight monthly declines according to WOWA.
The benchmark price also rose 3.5% year-over-year, indicating a robust market with steady demand.
Average Prices by Property Type (November 2024)

Townhouses led annual price growth at 15.2%, followed by semi-detached homes and apartments. Detached homes saw the lowest annual increase but remain the highest-priced category.
The monthly price change reflects market stabilization, with slight shifts based on property types.
Sales and Transactions by Property Type
Property Type
Transactions
Change (1-Month)
Change (1-Year)
Detached
865
-19.2%
+5.7%
Semi-Detached
173
-8.9%
+23.6%
Townhouse
330
-6.5%
+23.6%
Condo Apartment
429
-23.4%
-23.7%
Townhouses and semi-detached homes showed strong annual transaction growth (+23.6%), while detached homes also increased. However, condo apartment transactions declined both monthly and annually, highlighting a shift in buyer preferences.
Mortgage Rates

Mortgage rates for 4-year fixed terms vary significantly, with Butler Mortgage offering the lowest rate at 4.39%, while major banks like TD and Scotiabank have higher rates (6.77% and 6.34%, respectively). Lower rates may attract buyers despite rising home prices.
Calgary Housing Market Conditions (November 2024)
Metric
Value
SNLR
77%
Inventory
4,363 units
Inventory in Months
2.4 months
With an SNLR of 77%, Calgary’s market is deep in seller territory. Inventory increased by 45% year-over-year, but the supply remains tight at 2.4 months, sustaining a competitive environment for buyers.
Educational Attainment in Calgary (2016–2021)
Educational Attainment
2016
2021
5-Year Change (%)
Post-Secondary Qualification
604,225
612,515
+1.37%
High School or Equivalent
N/A
273,130
+6.17%
Calgary saw a modest increase of 1.37% in individuals with post-secondary qualifications between 2016 and 2021 according to Regional Dashboard.
This indicates stable growth in higher education levels among residents.
Educational Attainment Trends in Calgary (1981–2021)
Year
Post-Secondary Qualification
High School or Equivalent
1981
N/A
N/A
1986
N/A
N/A
1991
N/A
N/A
1996
N/A
N/A
2001
N/A
N/A
2006
N/A
N/A
2011
N/A
N/A
2016
604,225
N/A
2021
612,515
273,130
The largest growth was observed in the high school or equivalent category, which rose by 6.17% over five years, reaching 273,130 individuals. This suggests significant progress in foundational educational attainment.
View this post on Instagram
Income Distribution in Calgary
Income Range
Population
Percentage of Total
< 10k
88,650
8.83%
10k to 19k
95,485
9.52%
20k to 29k
150,395
14.99%
30k to 39k
120,085
11.97%
40k to 49k
102,800
10.24%
50k to 59k
84,010
8.37%
60k to 69k
69,945
6.97%
70k to 79k
56,175
5.60%
80k to 89k
43,630
4.35%
90k to 99k
36,520
3.64%
> 100k
155,825
15.53%
Calgary’s income distribution shows that the highest proportion of households (15.53%) earn more than $100,000 annually, reflecting a relatively affluent segment. The $20k–$29k income range also constitutes a significant portion (14.99%), suggesting income disparities as per WPR notes.
Key Income Metrics in Calgary

The average household income in Calgary is $129,000, which is higher than the median income of $98,000. This difference indicates that a small number of high-earning households are pulling the average upward, showcasing income inequality.
Methodology
- Data was sourced from 2021 Canadian Census, World Urbanization Prospects, and World Population Review.
- Housing statistics were compiled from WOWA and local market reports for November 2024.
- Employment data was derived from monthly reports by CREA and labor market updates.
- Income and demographic statistics were analyzed using insights from municipal and regional dashboards.
- Historical trends were reviewed using longitudinal data on education and age demographics.
- All figures were cross-referenced with reliable sources to ensure accuracy and relevance.
References
Statistics Canada – Census Profile, 2021 Census of Population
World Population Review – Calgary Population 2024
City of Calgary – Population Profile
WOWA – Calgary Housing Market
Point2Homes – Transgender and Non-Binary Demographics in Calgary
CREA – Calgary Employment Trends
Regional Dashboard – Educational Attainment in Calgary
World Population Review – Calgary Income Distribution